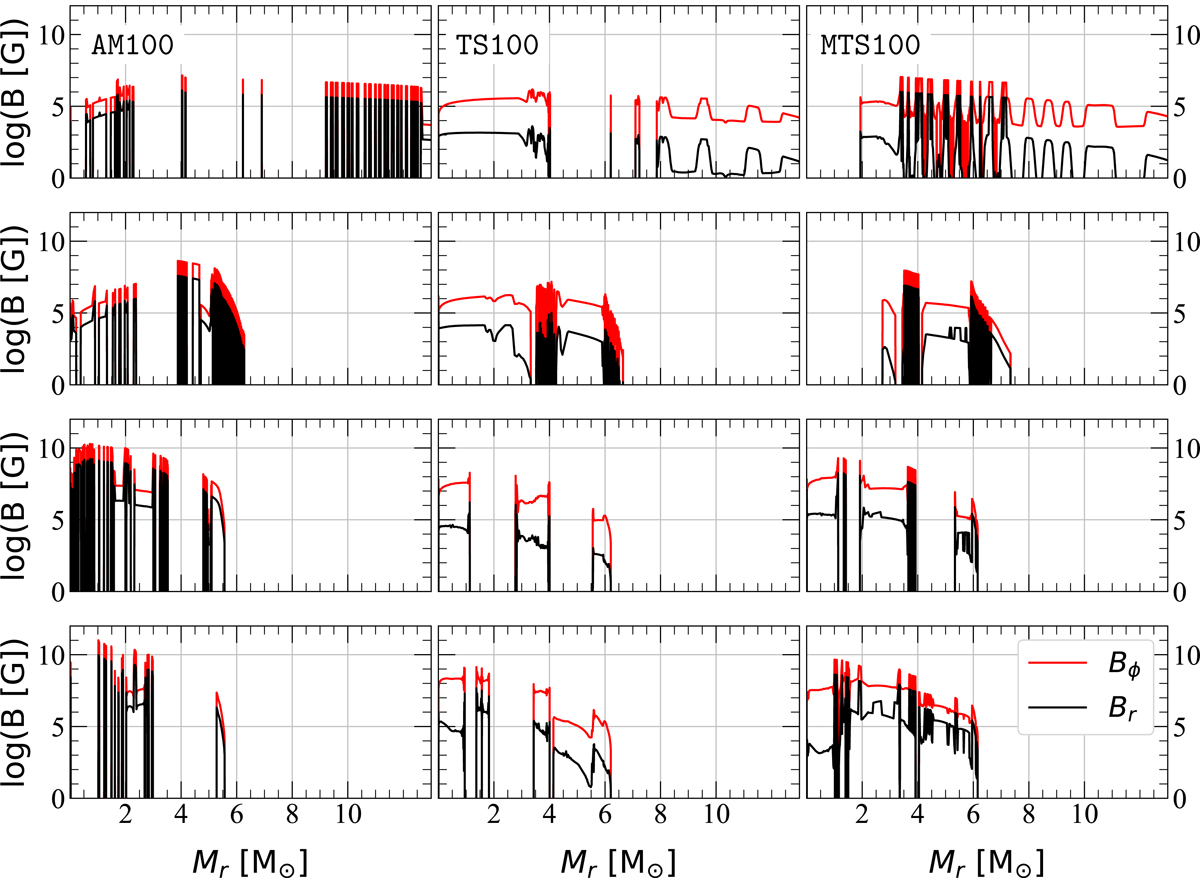
Fig. 8.
Download original image
Distribution with respect to mass of the toroidal magnetic field (in red) and the radial magnetic field (in black). We plot the magnetic field at the end of hydrogen burning (first row), at the end of helium burning (second row), at the end of carbon burning (third row), and at the end of oxygen burning (final row). Shown are model AM100 (left column), model TS100 (middle column), and MTS100 (right column).
Current usage metrics show cumulative count of Article Views (full-text article views including HTML views, PDF and ePub downloads, according to the available data) and Abstracts Views on Vision4Press platform.
Data correspond to usage on the plateform after 2015. The current usage metrics is available 48-96 hours after online publication and is updated daily on week days.
Initial download of the metrics may take a while.