Open Access
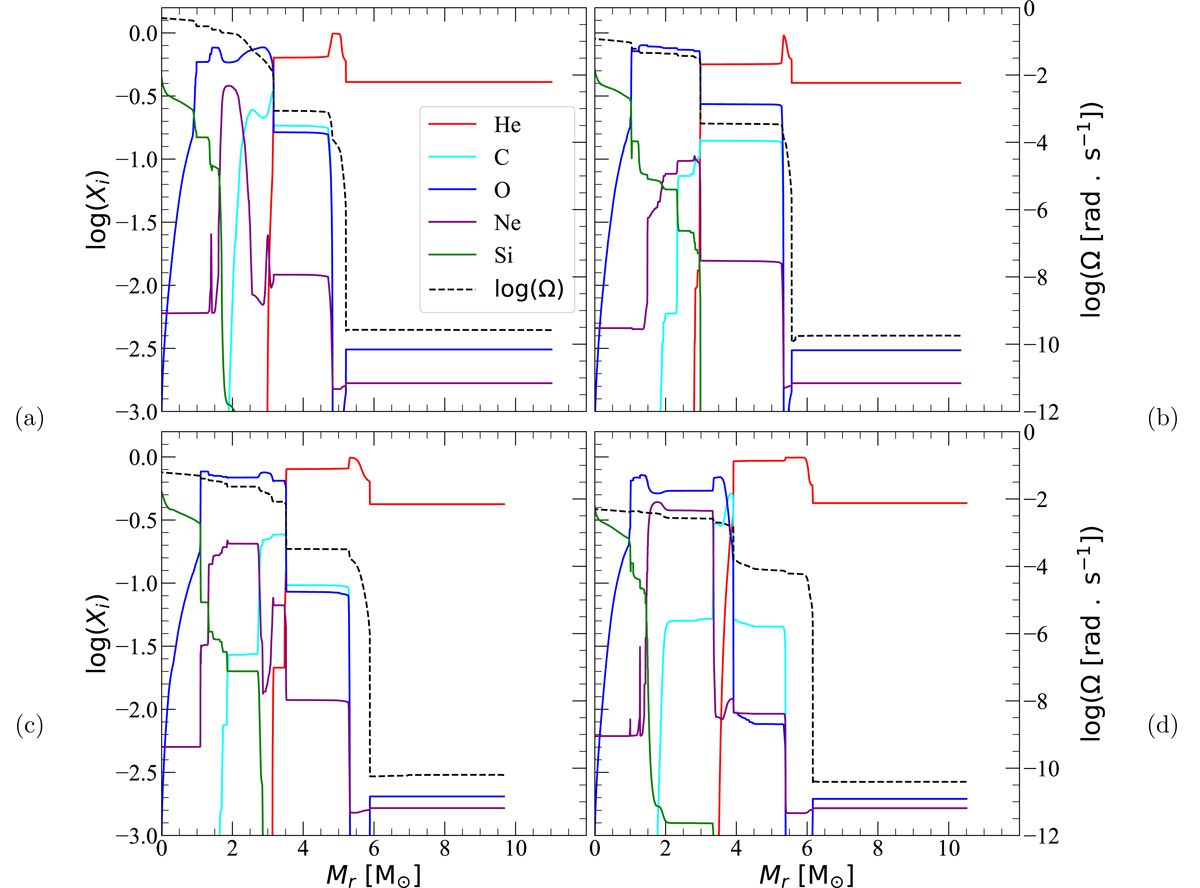
Fig. 7.
Download original image
Distribution with respect to mass of the composition reached at the end of oxygen burning for models AN100 (top left), AM100 (top right), DM100 (bottom left), and MTS100 (bottom right). The logarithm of the angular velocity, Ω, is shown in dotted lines, and the grid lines shown are those of the axis for log(Ω).
Current usage metrics show cumulative count of Article Views (full-text article views including HTML views, PDF and ePub downloads, according to the available data) and Abstracts Views on Vision4Press platform.
Data correspond to usage on the plateform after 2015. The current usage metrics is available 48-96 hours after online publication and is updated daily on week days.
Initial download of the metrics may take a while.