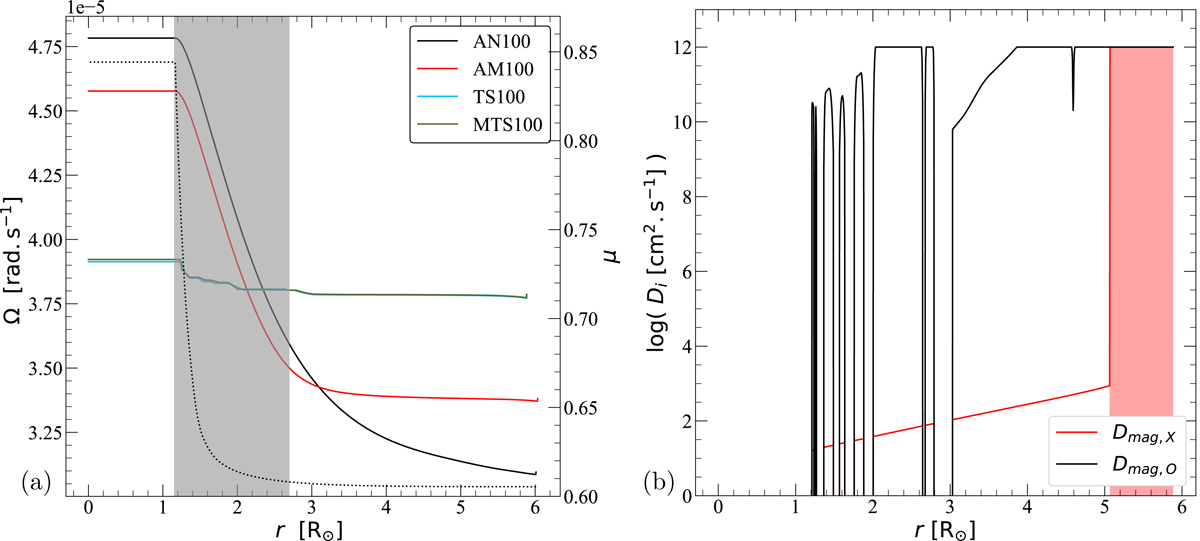
Fig. 4.
Download original image
Effects of the MRI and the TS dynamo during the MS. Left panel: same as in Fig. 1 but for the set of models discussed in Sect. 4.3. Right panel: (Restricted) diffusion coefficients for the transport of AM, Dmag, O (black), and for the transport of chemical elements, Dmag, X (red), for the sum of both magnetic instabilities in model MTS100 when the central hydrogen abundance reaches Xc = 0.35. The area highlighted in red shows where the MRI is active in the star.
Current usage metrics show cumulative count of Article Views (full-text article views including HTML views, PDF and ePub downloads, according to the available data) and Abstracts Views on Vision4Press platform.
Data correspond to usage on the plateform after 2015. The current usage metrics is available 48-96 hours after online publication and is updated daily on week days.
Initial download of the metrics may take a while.