Fig. 2.
Download original image
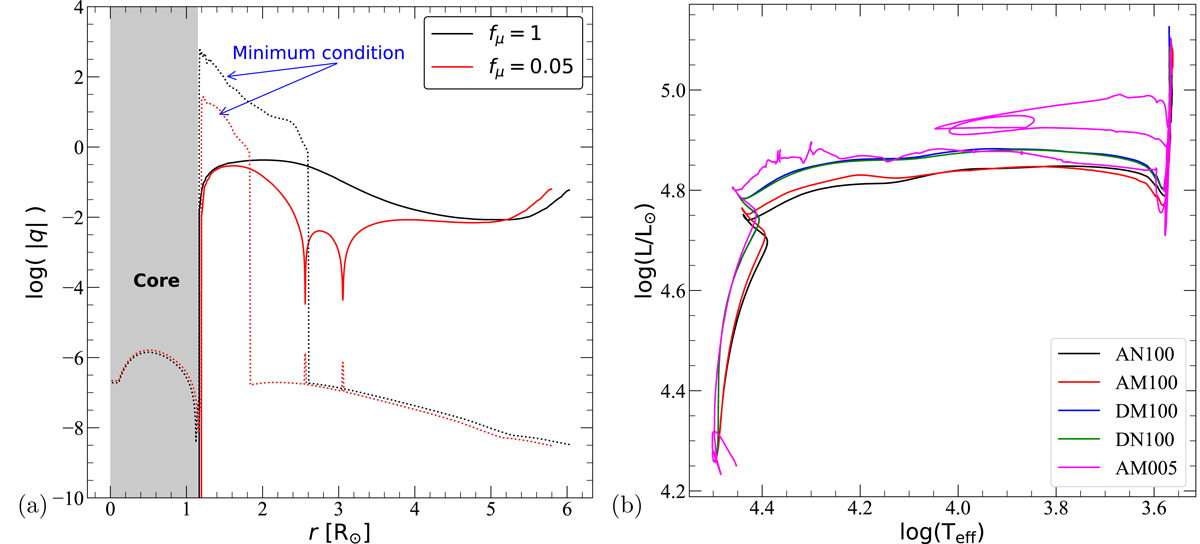
Minimum shear condition for the MRI and evolutionary tracks of our models. Left panel: logarithm of the absolute value of the shear, q, as a function of the radius when Xc = 0.35 for model AM100 (black) and model AM005 (red). The values of qmin, MRI given by the expression in Eq. (6) are plotted as dotted lines. The grey zone covers the convective core of the stellar models. Right panel: HR diagram showing the evolutionary tracks during the MS for various models (see legends).
Current usage metrics show cumulative count of Article Views (full-text article views including HTML views, PDF and ePub downloads, according to the available data) and Abstracts Views on Vision4Press platform.
Data correspond to usage on the plateform after 2015. The current usage metrics is available 48-96 hours after online publication and is updated daily on week days.
Initial download of the metrics may take a while.