Fig. 11.
Download original image
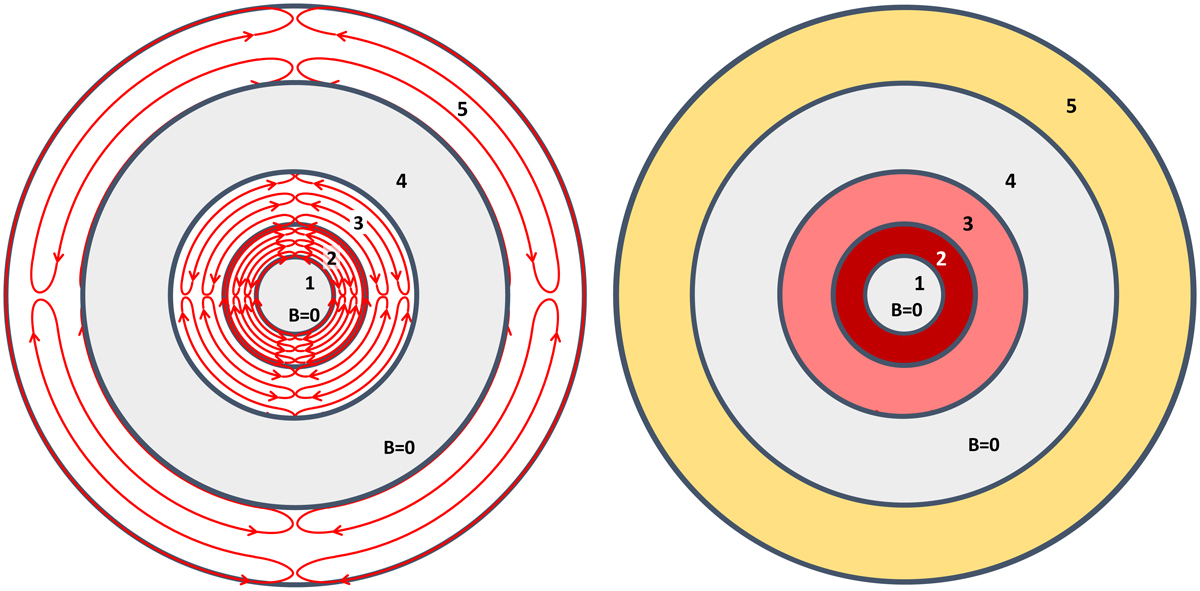
Schematic representation of the magnetisation of a model. Left: schematic structure of five stellar layers at a certain evolutionary time. Two of the layers are not magnetised (grey) and represent mass shells where the MRI or the TS dynamo cannot trigger. In layers 2, 3, and 5, magnetic instabilities have triggered. The approximate topology of the poloidal projection of the resulting magnetic field is represented by the red lines, with the direction of the field shown by the arrows. The schematic representation roughly corresponds to the field topology developed in MRI channel flows (perpendicular to the radial direction). While the magnetic field is clearly discontinuous between shells 3 and 5 (there are no magnetic field lines connecting the two regions), shells 2 and 3 may be connected. Right: schematic of the poloidal magnetic field in a 1D stellar evolution code. The root mean square values in shells 2, 3, and 5 replace the exact small-scale magnetic field topology shown in the left panel. Different colours denote distinct root mean square field strengths. The exact topology of the magnetic field lines is not accessible in the 1D representation.
Current usage metrics show cumulative count of Article Views (full-text article views including HTML views, PDF and ePub downloads, according to the available data) and Abstracts Views on Vision4Press platform.
Data correspond to usage on the plateform after 2015. The current usage metrics is available 48-96 hours after online publication and is updated daily on week days.
Initial download of the metrics may take a while.