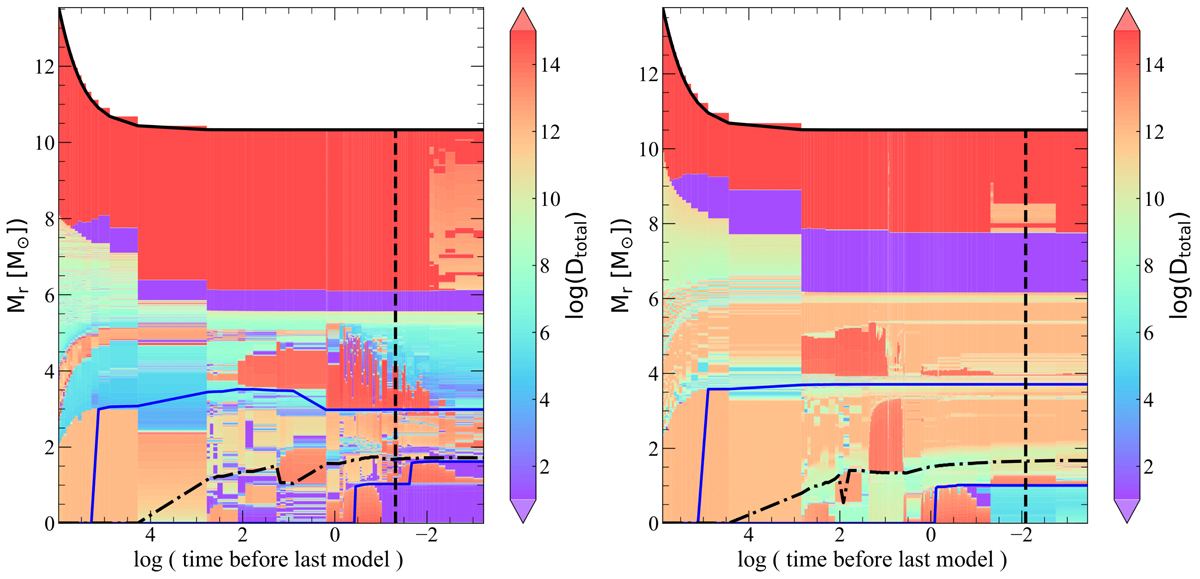
Fig. 10.
Download original image
Kippenhahn-like diagram of the diffusion coefficient for AM transport given by Eq. (29) for models AM100 (left) and MTS100 (right). The y axis is the Lagrangian mass coordinate. The x4 axis is the decimal logarithm of the time before the last computed model. We plot roughly from the end of the MS. As the two models are not computed up to exactly the same time, this axis is not directly comparable. The vertical dashed black line shows the time when oxygen burning ends, which is the same time as in the plots of Fig. 7. The blue lines correspond to the inner and outer limits of the oxygen shell, defined as XO16 > 0.5, and the dot-dash black line corresponds to the evolution of M4 Eq. (36).
Current usage metrics show cumulative count of Article Views (full-text article views including HTML views, PDF and ePub downloads, according to the available data) and Abstracts Views on Vision4Press platform.
Data correspond to usage on the plateform after 2015. The current usage metrics is available 48-96 hours after online publication and is updated daily on week days.
Initial download of the metrics may take a while.