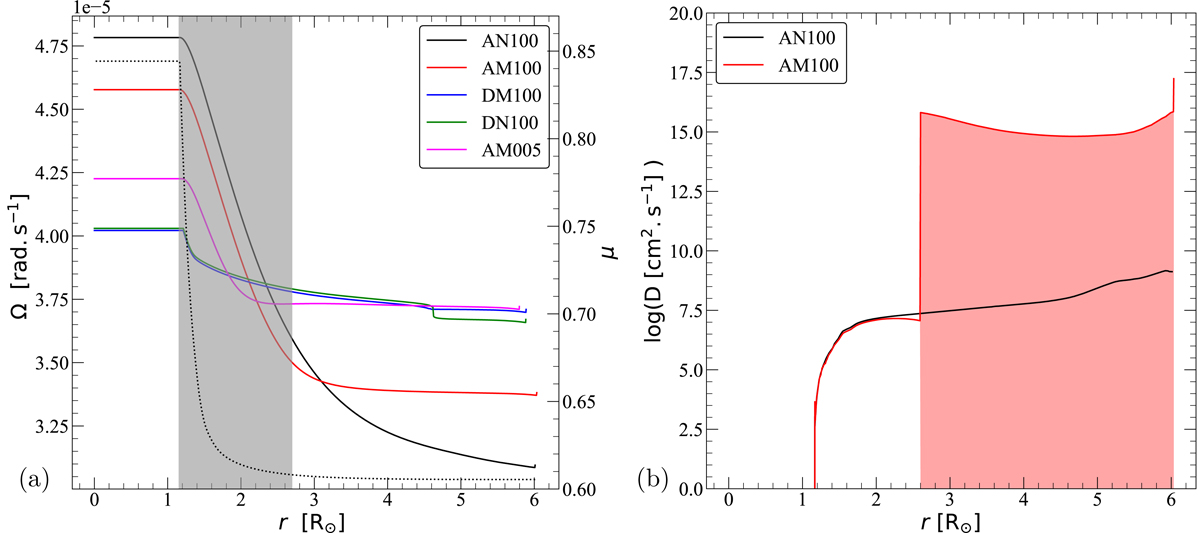
Fig. 1.
Download original image
Effects of the MRI during the MS. Left panel: distribution of angular velocity, Ω, when the core hydrogen abundance reaches Xc = 0.35 for different models. For model AN100, we show with a dotted line the mean molecular weight, μ. The area in grey indicates where the μ gradient is strong enough to suppress MRI activation in model AM100. Right panel: comparison at Xc = 0.35 of the unrestricted AM diffusion coefficient D = Dshear + DMRI, given by Eqs. (23) and (10), for model AN000 (black) and model AM100 (red). The zone in shaded red shows the radial extension of the region where the MRI is active in model AM100.
Current usage metrics show cumulative count of Article Views (full-text article views including HTML views, PDF and ePub downloads, according to the available data) and Abstracts Views on Vision4Press platform.
Data correspond to usage on the plateform after 2015. The current usage metrics is available 48-96 hours after online publication and is updated daily on week days.
Initial download of the metrics may take a while.