Fig. 9.
Download original image
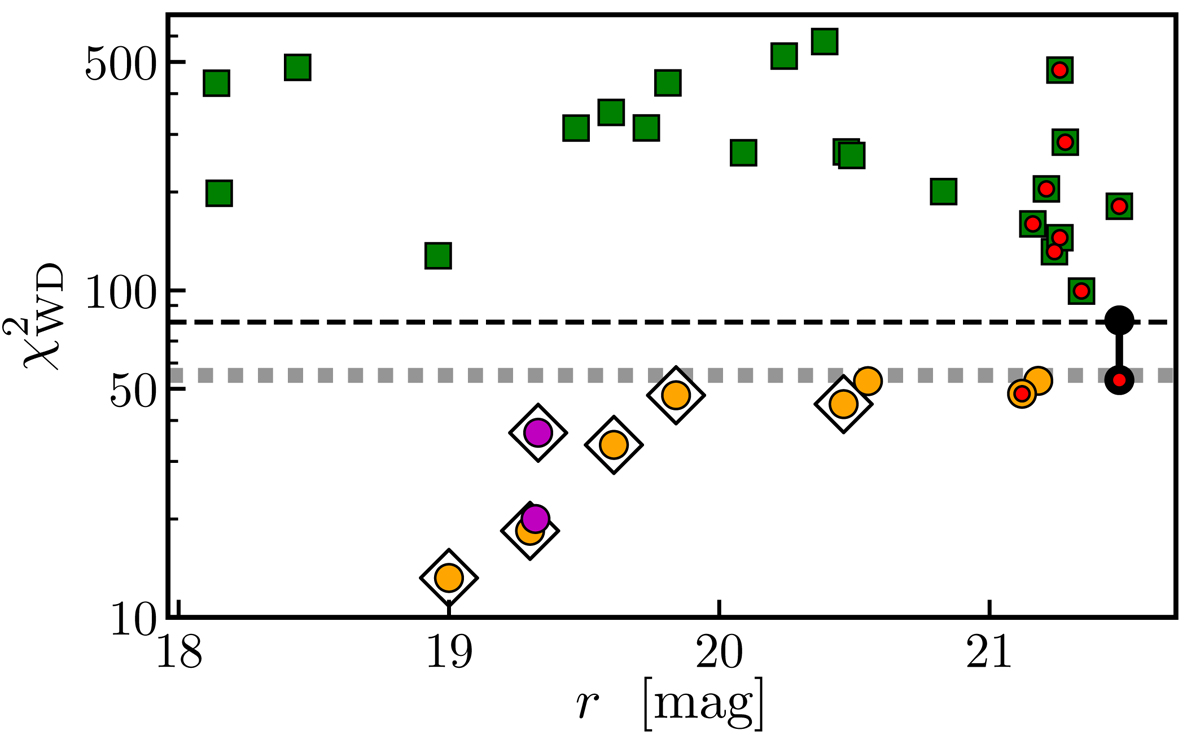
Minimum ![]() as a function of the r-band magnitude for the BPS. Circles mark spectroscopic white dwarfs (H-dominated, orange; He-dominated, purple; and metal-polluted, black), and green squares show QSOs. The values obtained with and without the filters J0390 and J0410 for the calcium white dwarf 2243–4859 are connected by a black line. Those sources without Gaia DR3 parallax information are marked with a red dot. Those white dwarfs included in the Gentile Fusillo et al. (2021) catalog are marked with a white diamond. The black dashed line depicts the separation between white dwarfs and QSOs,
as a function of the r-band magnitude for the BPS. Circles mark spectroscopic white dwarfs (H-dominated, orange; He-dominated, purple; and metal-polluted, black), and green squares show QSOs. The values obtained with and without the filters J0390 and J0410 for the calcium white dwarf 2243–4859 are connected by a black line. Those sources without Gaia DR3 parallax information are marked with a red dot. Those white dwarfs included in the Gentile Fusillo et al. (2021) catalog are marked with a white diamond. The black dashed line depicts the separation between white dwarfs and QSOs, ![]() . The dotted line shows the expected value for white dwarfs given the degrees of freedom in the analysis,
. The dotted line shows the expected value for white dwarfs given the degrees of freedom in the analysis, ![]() .
.
Current usage metrics show cumulative count of Article Views (full-text article views including HTML views, PDF and ePub downloads, according to the available data) and Abstracts Views on Vision4Press platform.
Data correspond to usage on the plateform after 2015. The current usage metrics is available 48-96 hours after online publication and is updated daily on week days.
Initial download of the metrics may take a while.