Fig. 8.
Download original image
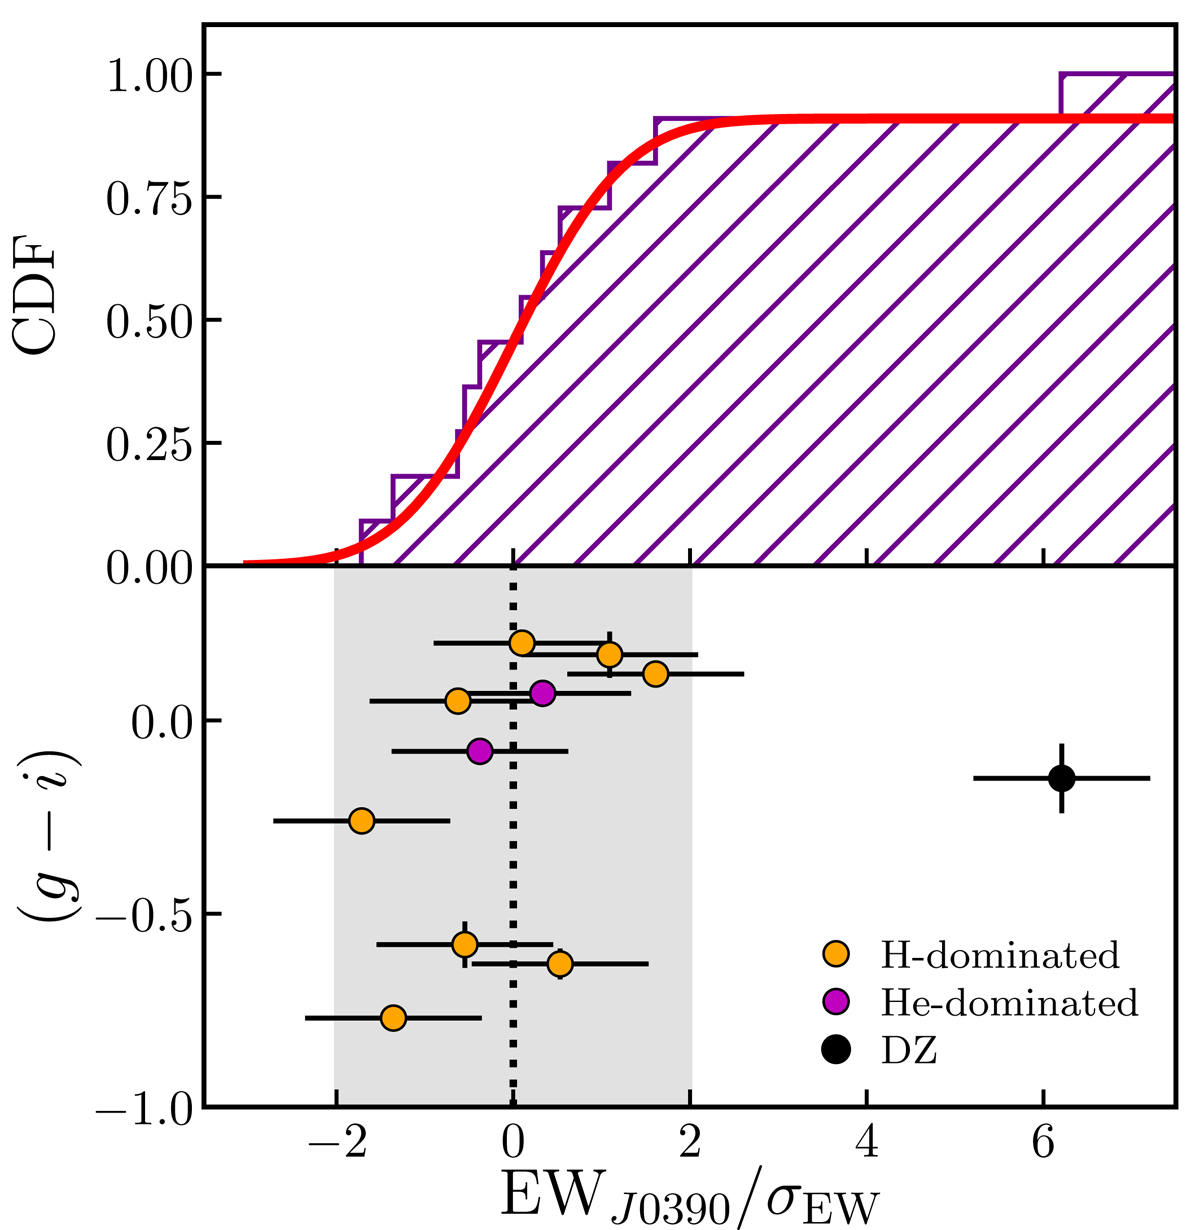
Distribution in the significance of the EWJ0390 measurements as a proxy for calcium absorption in white dwarfs. Top panel: cumulative distribution function (CDF) of the EWJ0390 significance. The solid red line is the CDF of a normal distribution normalized to the non-DZ population. Bottom panel: color (g − i) as a function of the EWJ0390 significance. Symbols are the same as in Fig. 1. The dotted line marks zero and the gray area shows the ±2σ interval.
Current usage metrics show cumulative count of Article Views (full-text article views including HTML views, PDF and ePub downloads, according to the available data) and Abstracts Views on Vision4Press platform.
Data correspond to usage on the plateform after 2015. The current usage metrics is available 48-96 hours after online publication and is updated daily on week days.
Initial download of the metrics may take a while.