Fig. 2.
Download original image
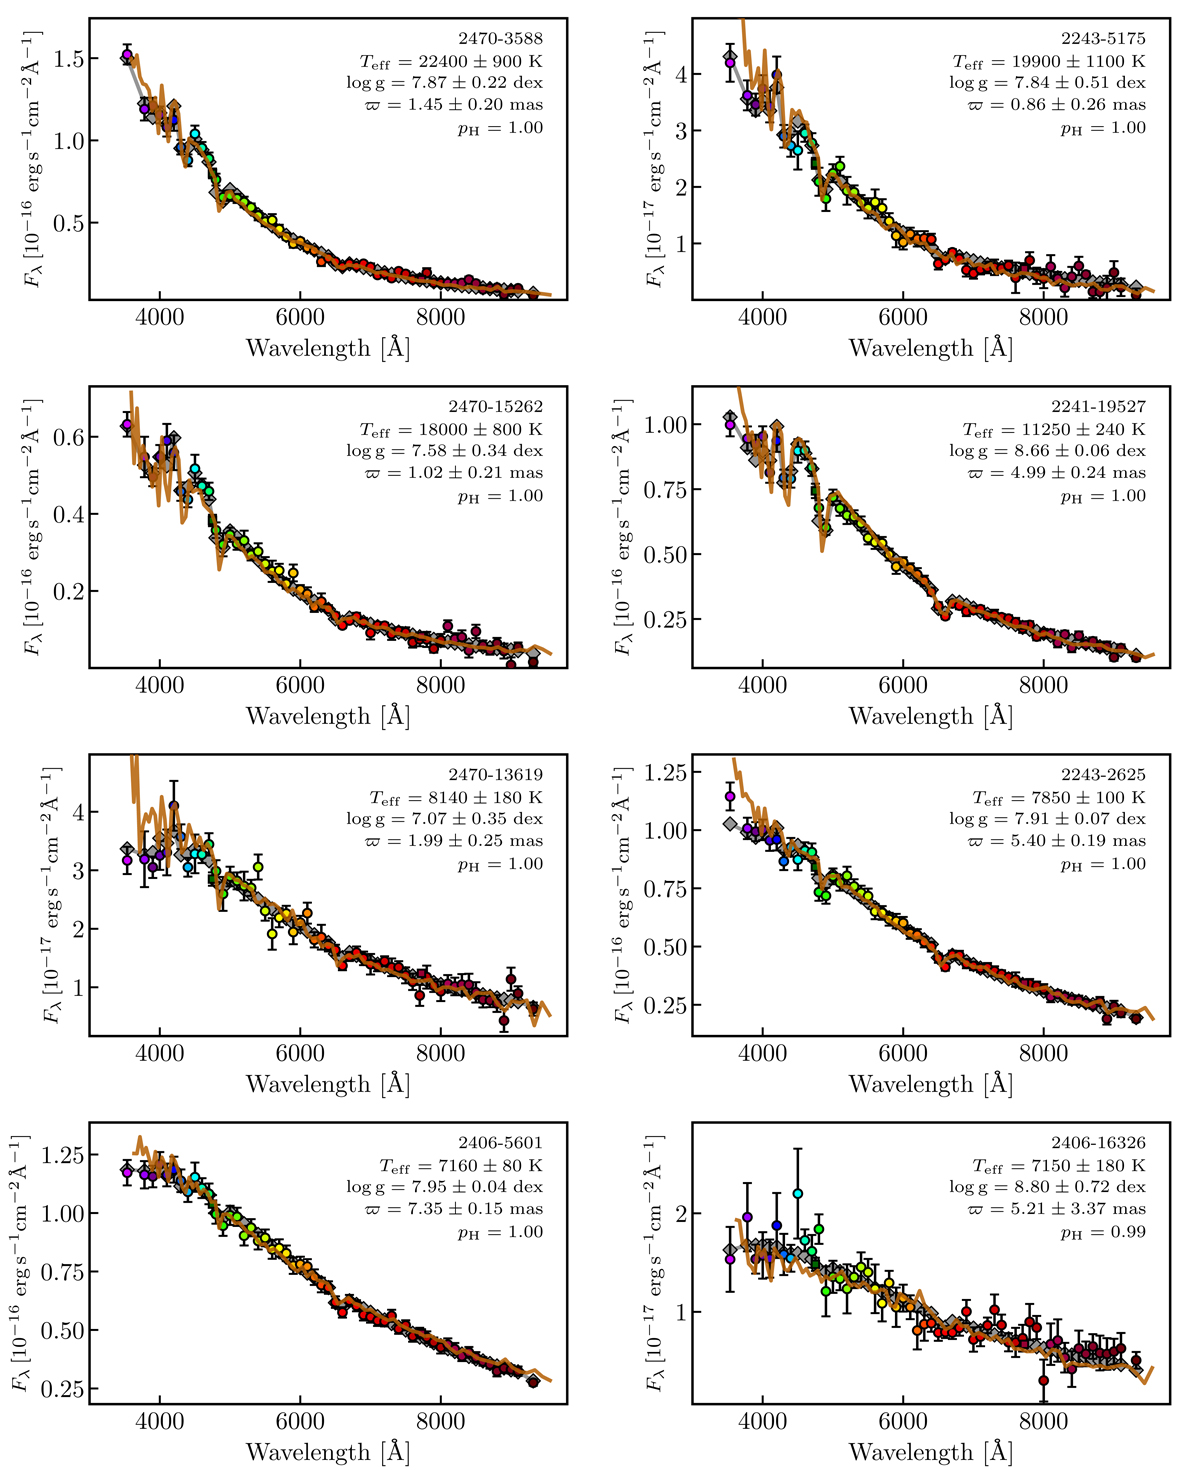
Photo-spectra of the miniJPAS sources classified as H-dominated DAs in descending effective temperature from the top-left to bottom-right corner. Colored circles represent the 56 medium bands, and squares indicate the g and i broadbands. The presented fluxes were estimated from the 3 arcsec diameter aperture photometry corrected for aperture effects (Sect. 2.2), and no correction for interstellar reddening was applied. The gray diamonds show the theoretical flux from the best-fitting model to the data. The parameters of the fitting are labeled in the panels. The solid brown line depicts the SDSS spectra of the sources with a downgraded resolution of R ∼ 90 for a better comparison. The flux of the SDSS spectra were scaled to match the miniJPAS r-band photometry. The flux scale of the SDSS spectra for the sources 2243–2625, 2406–5601, and 2406–16326 has an additional factor (λ/λ0)a applied, with λ0 = 6254 Å and a = 1.1, 0.3, and −0.4, respectively.
Current usage metrics show cumulative count of Article Views (full-text article views including HTML views, PDF and ePub downloads, according to the available data) and Abstracts Views on Vision4Press platform.
Data correspond to usage on the plateform after 2015. The current usage metrics is available 48-96 hours after online publication and is updated daily on week days.
Initial download of the metrics may take a while.