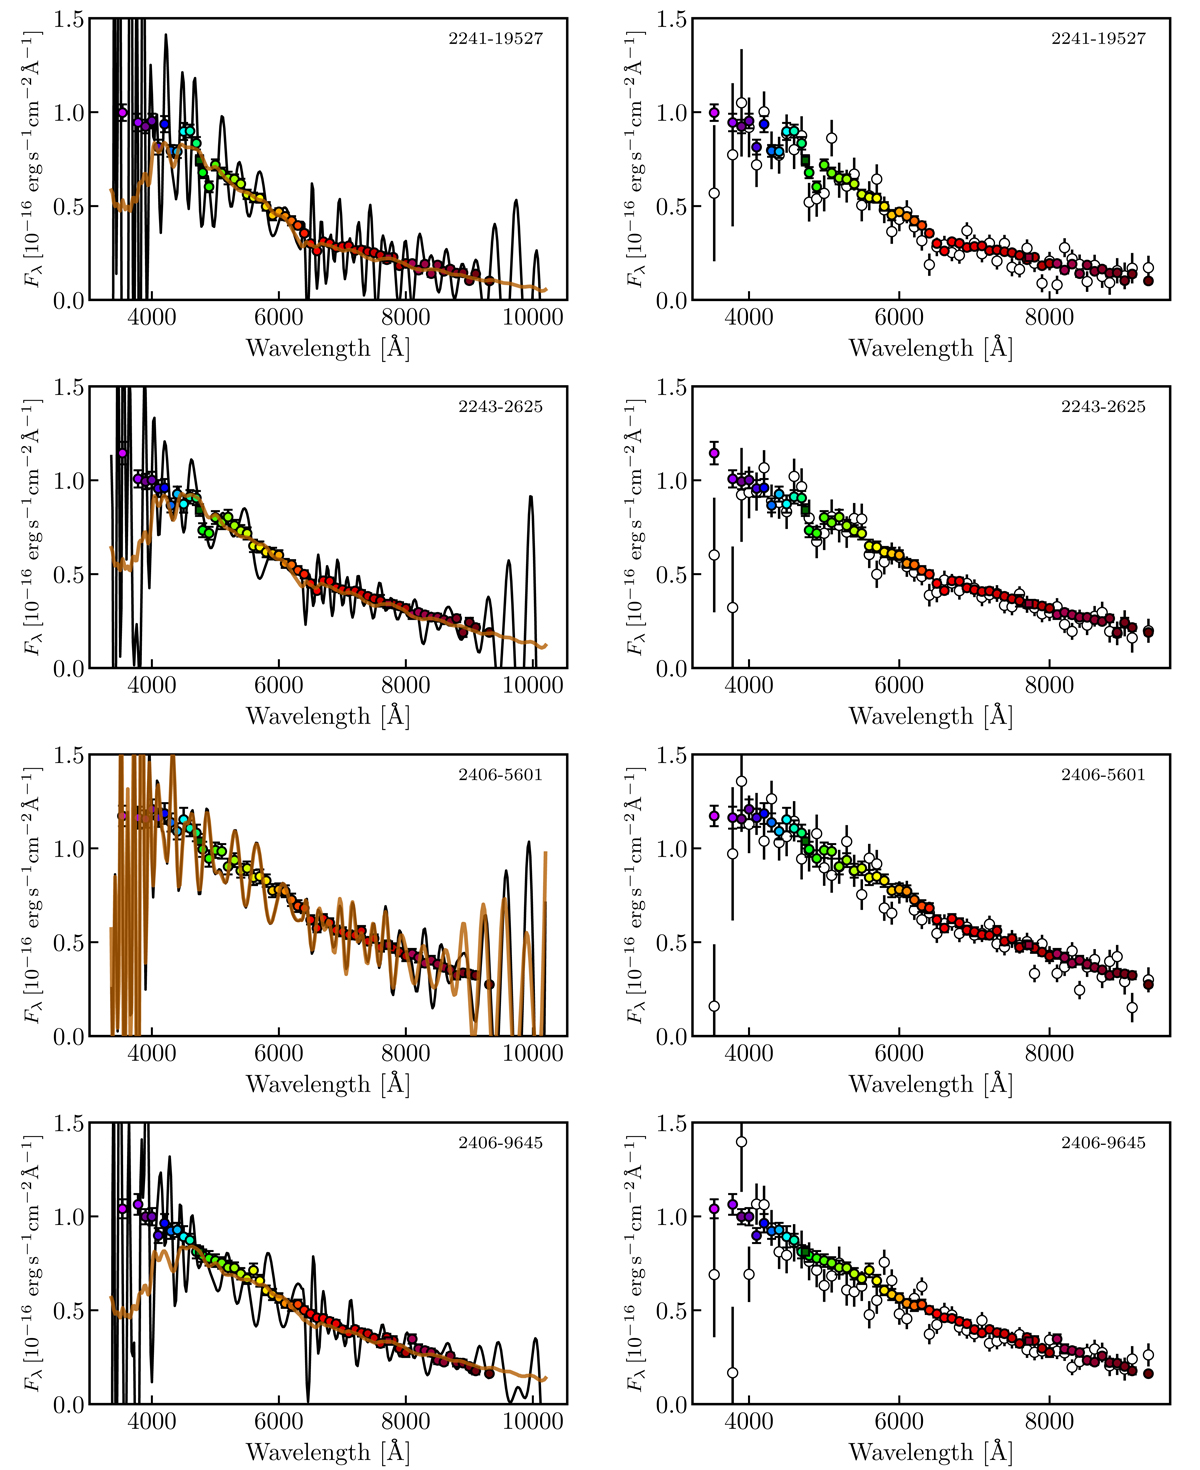
Fig. 10.
Download original image
Photo-spectra of the four miniJPAS sources with BP/RP spectra released in Gaia DR3. Colored symbols are the same as in Fig. 2. The solid black and brown lines in the left panels show the reconstructed spectra from the basis coefficients without and with truncation, respectively. The white dots in the right panels present the synthetic photometry computed from the BP/RP full reconstructed spectra and the J-PAS photometric system. No offset has been applied to the Gaia DR3 flux scale.
Current usage metrics show cumulative count of Article Views (full-text article views including HTML views, PDF and ePub downloads, according to the available data) and Abstracts Views on Vision4Press platform.
Data correspond to usage on the plateform after 2015. The current usage metrics is available 48-96 hours after online publication and is updated daily on week days.
Initial download of the metrics may take a while.