Fig. 1.
Download original image
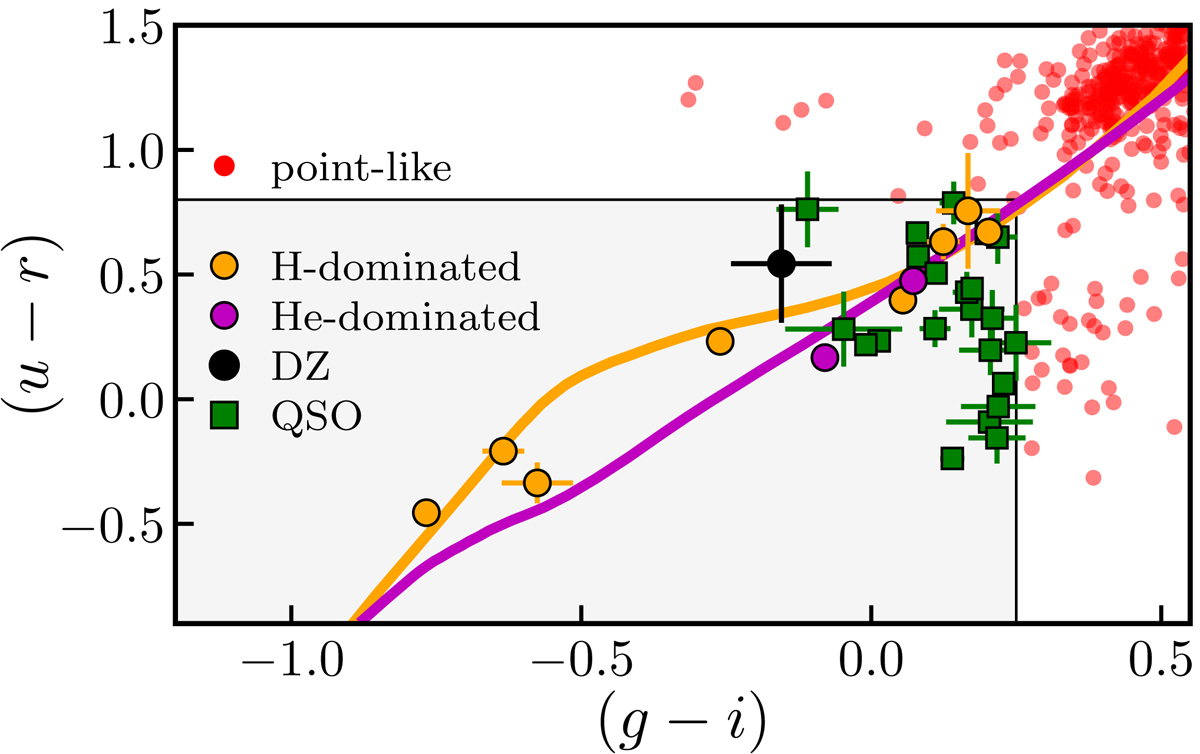
(u − r) vs. (g − i) color–color diagram in miniJPAS for point-like sources with r < 21.5 mag (red dots). The gray area defines the bluest point-like sources with (u − r)< 0.80 mag and (g − i)< 0.25 mag. The 33 sources in this area are classified from the SDSS spectrum as 11 white dwarfs (eight with a H-dominated atmosphere, orange dots; two with a He-dominated atmosphere, purple dots; and one metal-polluted DZ, black dot) and 22 QSOs (green squares). The expected colors from theoretical cooling tracks for H-dominated and He-dominated atmospheres with logg = 8 (Sect. 3) are shown with the orange and purple lines, respectively.
Current usage metrics show cumulative count of Article Views (full-text article views including HTML views, PDF and ePub downloads, according to the available data) and Abstracts Views on Vision4Press platform.
Data correspond to usage on the plateform after 2015. The current usage metrics is available 48-96 hours after online publication and is updated daily on week days.
Initial download of the metrics may take a while.