Open Access
Fig. 9
Download original image
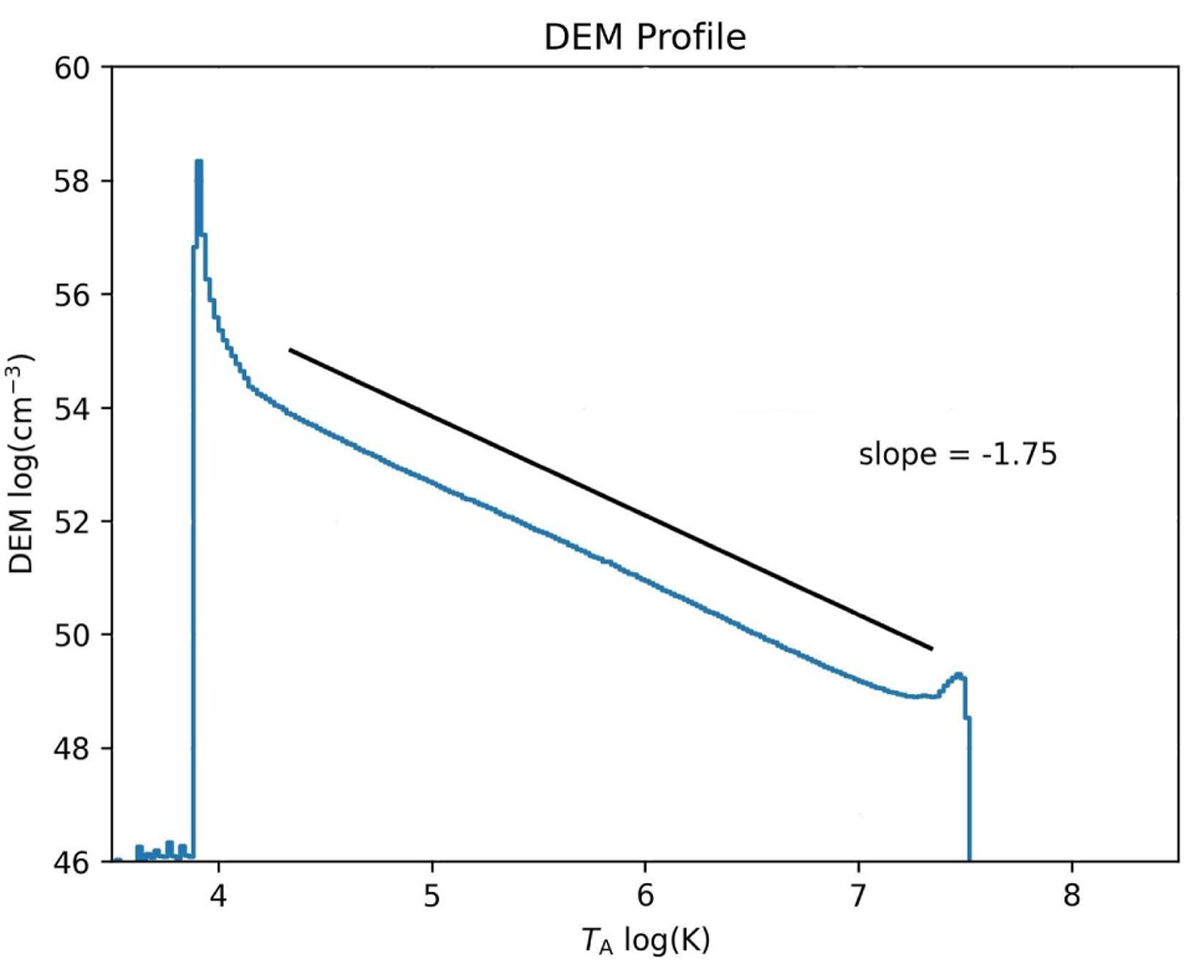
Differential emission measure profile of the simulated nebula (unabsorbed) from the Z01 simulation, after 0.13492 Myr of evolution. The black line represents the slope of the DEM profile between 104.2 K and 107.2 K.
Current usage metrics show cumulative count of Article Views (full-text article views including HTML views, PDF and ePub downloads, according to the available data) and Abstracts Views on Vision4Press platform.
Data correspond to usage on the plateform after 2015. The current usage metrics is available 48-96 hours after online publication and is updated daily on week days.
Initial download of the metrics may take a while.