Open Access
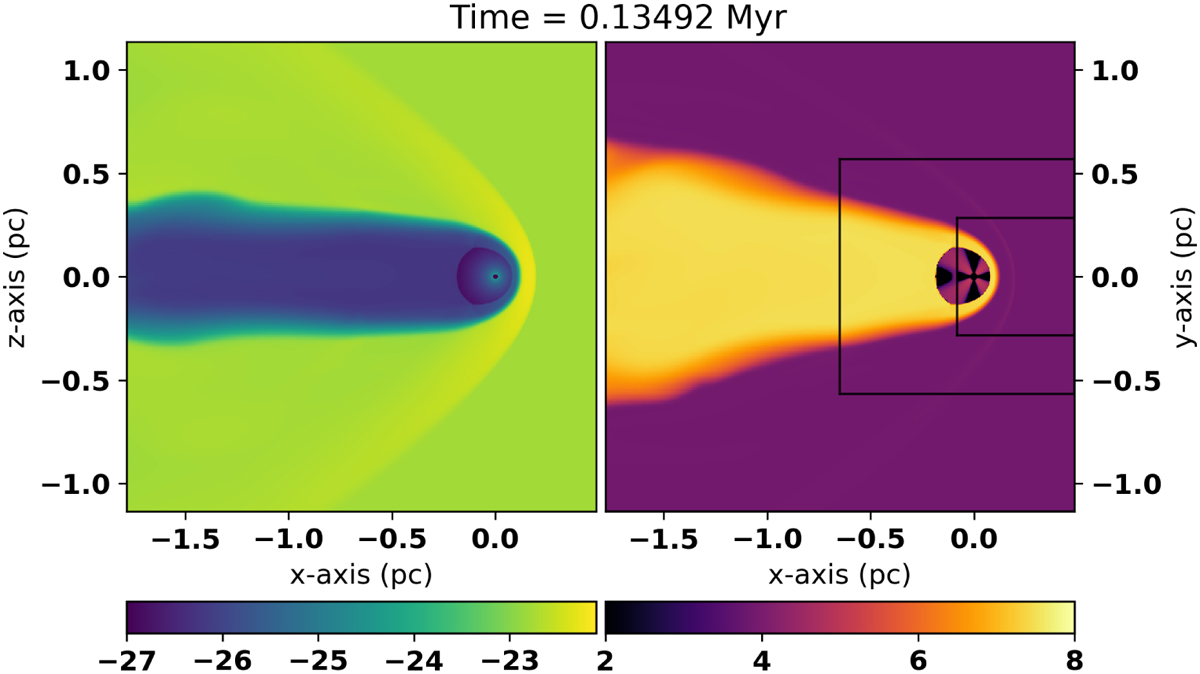
Fig. 5
Download original image
Simulation Z01. Left: plots of the Log10 gas density (g cm−3), slice through the (x–z) plane at y = 0. Right: plots of the Log10 gas temperature (K), slice through the (x–y) plane at z = 0. The borders of the nested-grid levels are shown in black. The star is at the origin.
Current usage metrics show cumulative count of Article Views (full-text article views including HTML views, PDF and ePub downloads, according to the available data) and Abstracts Views on Vision4Press platform.
Data correspond to usage on the plateform after 2015. The current usage metrics is available 48-96 hours after online publication and is updated daily on week days.
Initial download of the metrics may take a while.