Fig. 3
Download original image
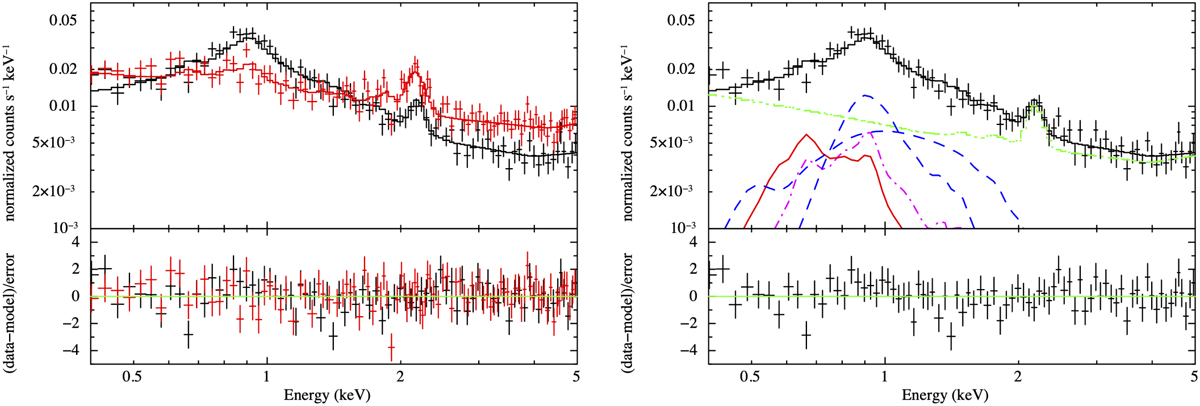
Chandra X-ray spectra of the extended emission of ζ Ophiuchi. Left: Chandra X-ray spectra of the extended emission region (black) and the background (red). The best-fit models are shown as solid lines and the fit residuals are shown in the lower panel. Right: extended emission spectrum only with the additive model components shown. The green dash-dot-dot line represents the combined NXB components constrained using the stowed observations, the dashed blue lines show the ζ Ophiuchi emission components, the magenta dash-dot line is the AXB component, and the red solid line shows the diffuse emission component.
Current usage metrics show cumulative count of Article Views (full-text article views including HTML views, PDF and ePub downloads, according to the available data) and Abstracts Views on Vision4Press platform.
Data correspond to usage on the plateform after 2015. The current usage metrics is available 48-96 hours after online publication and is updated daily on week days.
Initial download of the metrics may take a while.