Open Access
Fig. 12
Download original image
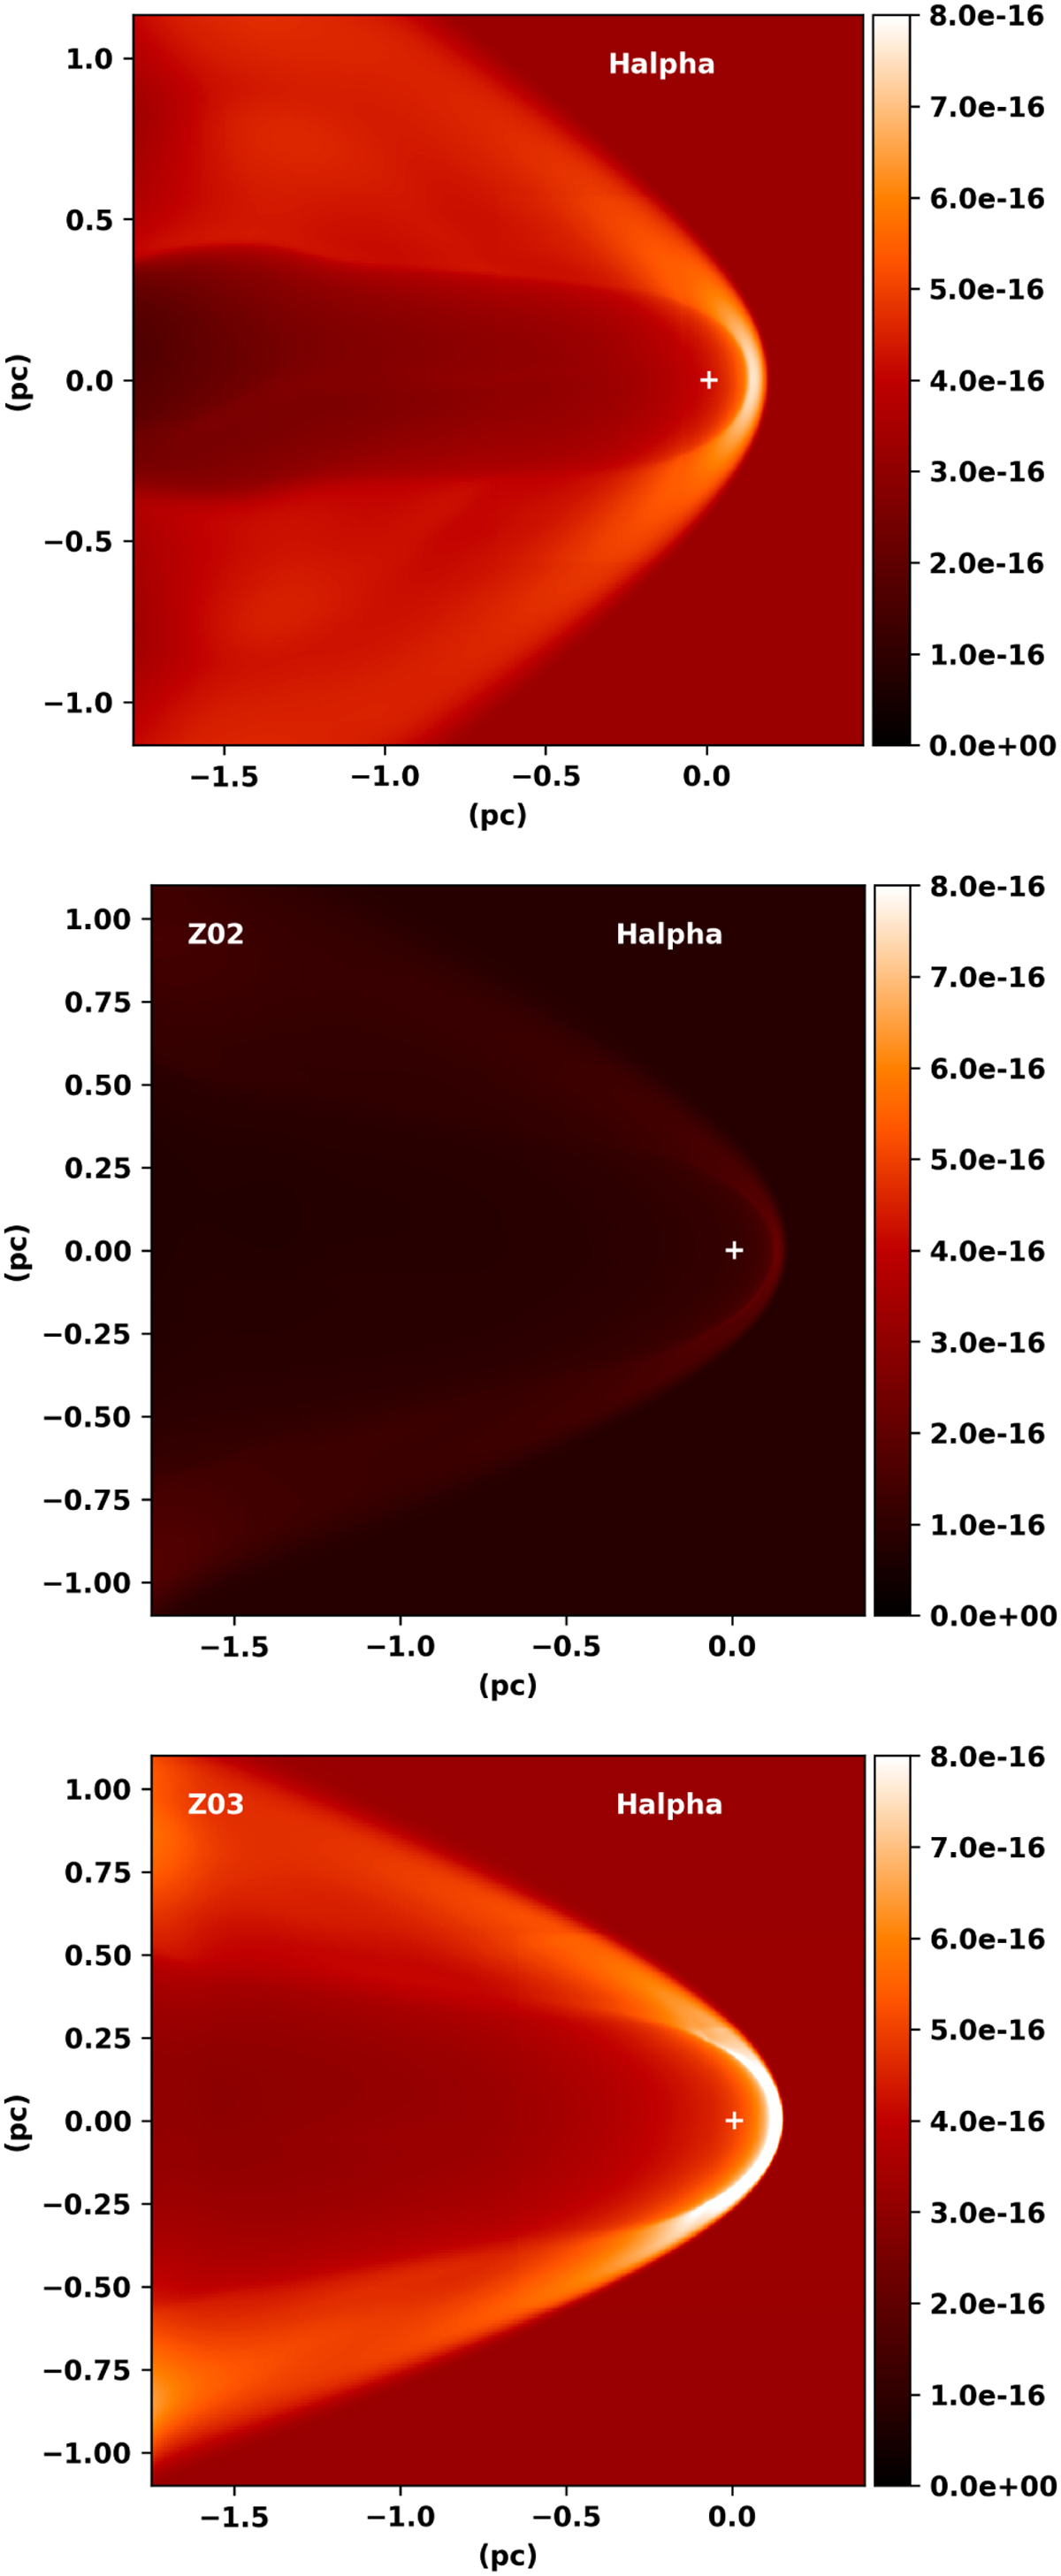
Synthetic Hα emission maps of the simulated nebula around ζ Ophiuchi on a linear scale in units of erg cm−2 s−1 arcsec−2. Top: Z01 with the line of sight being the y-axis. Middle: Z02. Bottom: Z03. Coordinates in parsecs relative to the position of the star (white cross).
Current usage metrics show cumulative count of Article Views (full-text article views including HTML views, PDF and ePub downloads, according to the available data) and Abstracts Views on Vision4Press platform.
Data correspond to usage on the plateform after 2015. The current usage metrics is available 48-96 hours after online publication and is updated daily on week days.
Initial download of the metrics may take a while.