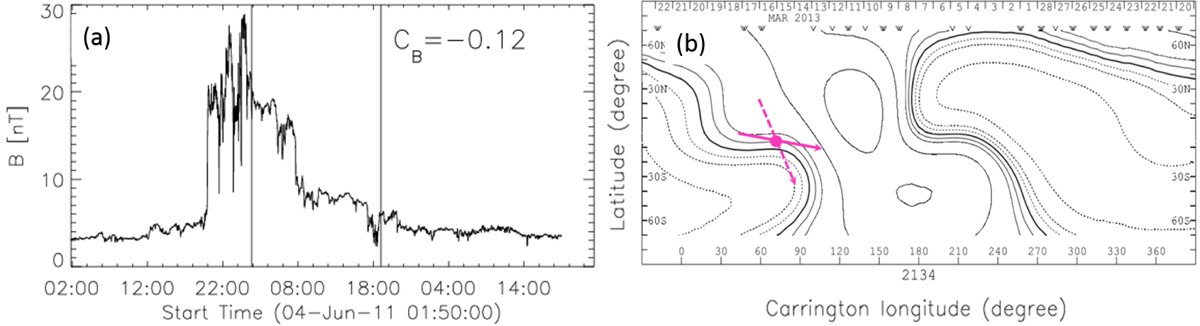
Fig. 6.
Download original image
(a) Asymmetry in in-situ magnetic field intensity associated with event 2 MC. The FR asymmetry parameter CB is lablled in the figure. The vertical lines represent the start and end times of the MC. (b) coronal map during CR 2134 collected from the Wilcox solar observatory. The grey contours represent the positive field region, and the dotted contours indicate the negative field region. The HCS is represented by the thick solid black line. The pink circle indicates the location of the CME associated with event 7. The dashed and solid pink lines show the CME axis orientations before and after rotation, respectively.
Current usage metrics show cumulative count of Article Views (full-text article views including HTML views, PDF and ePub downloads, according to the available data) and Abstracts Views on Vision4Press platform.
Data correspond to usage on the plateform after 2015. The current usage metrics is available 48-96 hours after online publication and is updated daily on week days.
Initial download of the metrics may take a while.