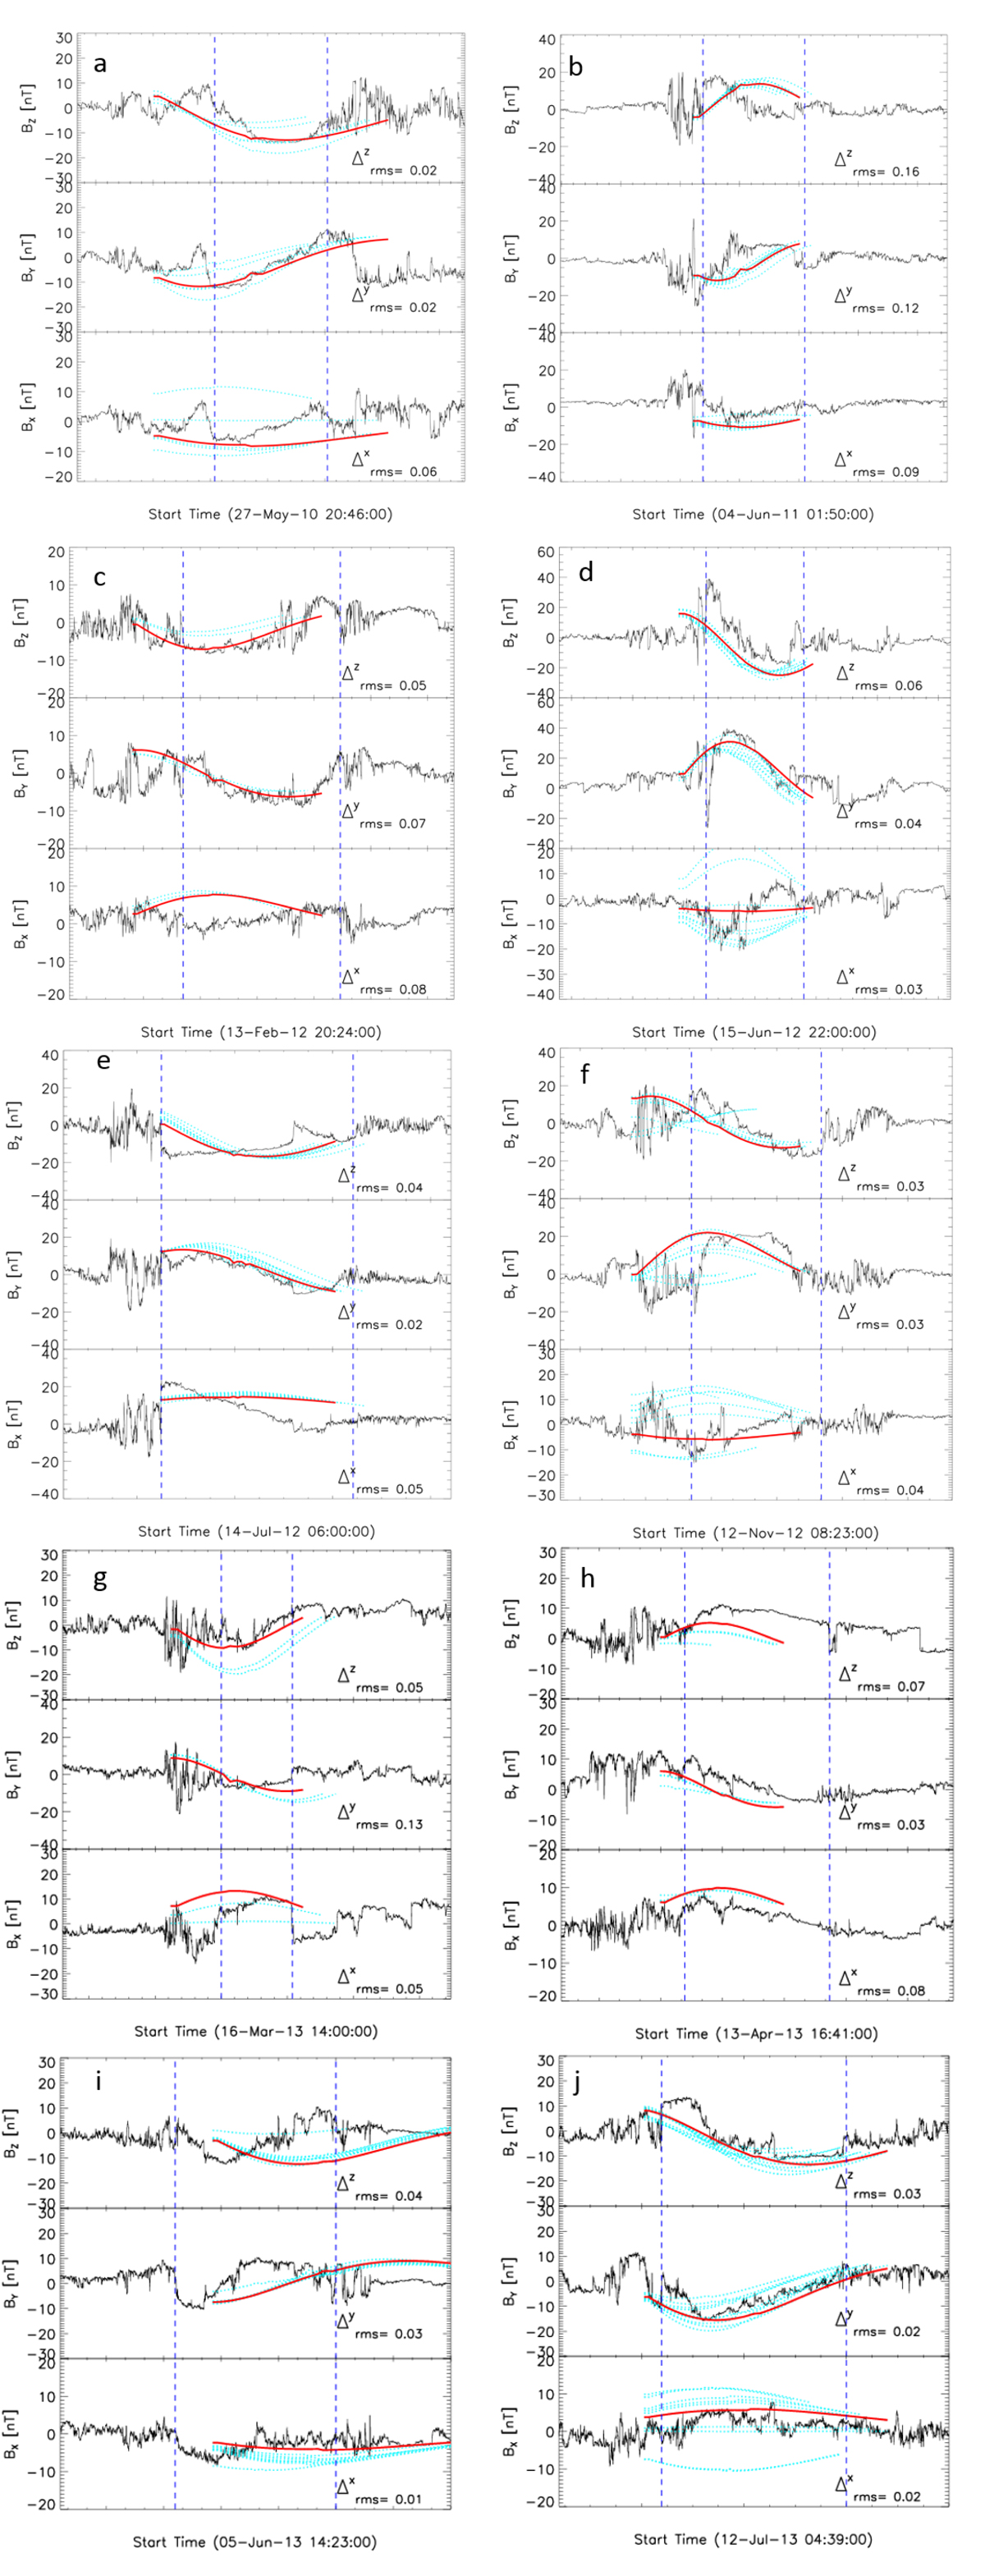
Fig. 5.
Download original image
Magnetic vectors (in black) of ten MCs as observed by the ACE spacecraft. The red curves represent the predicted magnetic vectors that match the observed magnetic vectors best. The cyan dotted curves show the uncertainty in predictions. The vertical dashed blue lines denote the start and end time of MCs. The rms differences ![]() , and
, and ![]() between observed and predicted magnetic vectors Bx, By, and Bz are labelled in the plot.
between observed and predicted magnetic vectors Bx, By, and Bz are labelled in the plot.
Current usage metrics show cumulative count of Article Views (full-text article views including HTML views, PDF and ePub downloads, according to the available data) and Abstracts Views on Vision4Press platform.
Data correspond to usage on the plateform after 2015. The current usage metrics is available 48-96 hours after online publication and is updated daily on week days.
Initial download of the metrics may take a while.