Fig. 4.
Download original image
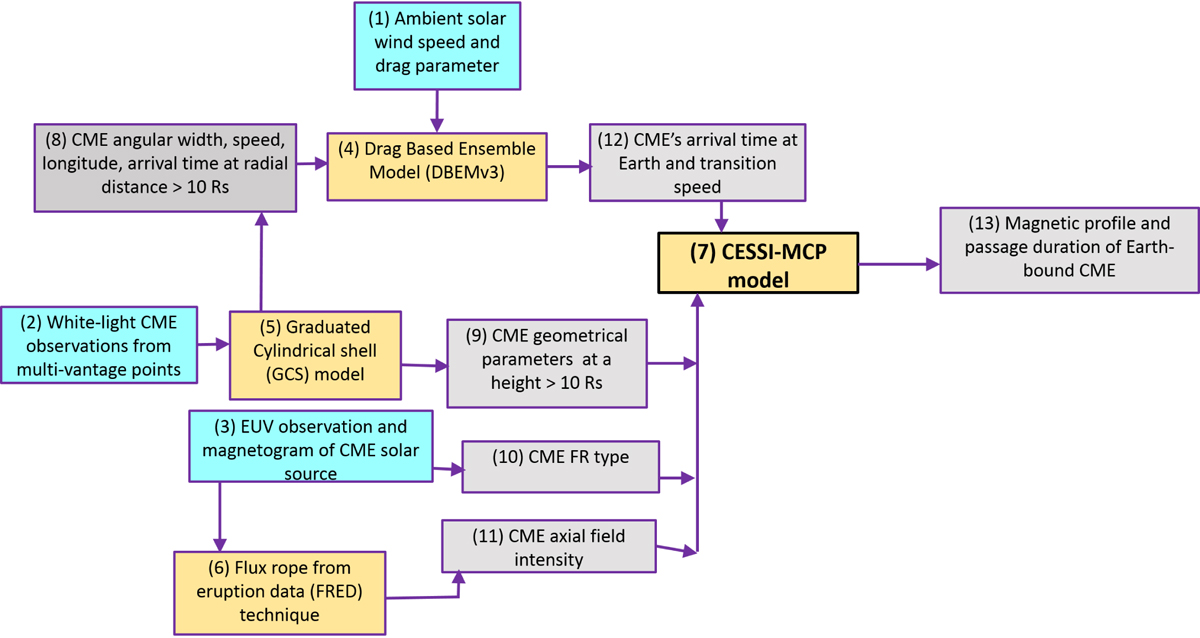
Block diagram representing the steps involved in our analytical approach to predict Earth-bound CME magnetic vectors and passage duration. The cyan blocks 1–3 contain near-Sun remote observations that were used as inputs. The yellow blocks 4–7 indicate the models and techniques involved in our approach. The grey blocks 8–13 indicate the outputs.
Current usage metrics show cumulative count of Article Views (full-text article views including HTML views, PDF and ePub downloads, according to the available data) and Abstracts Views on Vision4Press platform.
Data correspond to usage on the plateform after 2015. The current usage metrics is available 48-96 hours after online publication and is updated daily on week days.
Initial download of the metrics may take a while.