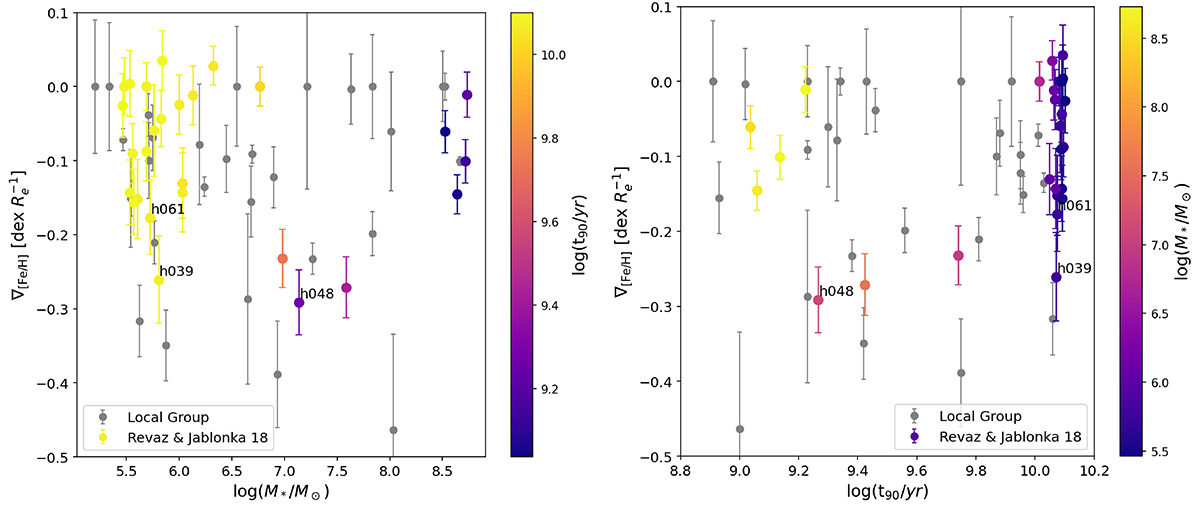
Fig. 7.
Download original image
Distribution of the metallicity gradients calculated for the simulated systems presented in Revaz & Jablonka (2018), on the left panel as a function of their stellar mass and color-coded according to their t90, while inverting these two variables in the right panel. Numbers identify the individual halos mentioned in the main text, while the gradient values for the Local Group dwarf galaxies presented in this work are shown as grey circles with their associated error bars. We have assumed in this case a stellar mass-to-light ratio of one.
Current usage metrics show cumulative count of Article Views (full-text article views including HTML views, PDF and ePub downloads, according to the available data) and Abstracts Views on Vision4Press platform.
Data correspond to usage on the plateform after 2015. The current usage metrics is available 48-96 hours after online publication and is updated daily on week days.
Initial download of the metrics may take a while.