Fig. 6.
Download original image
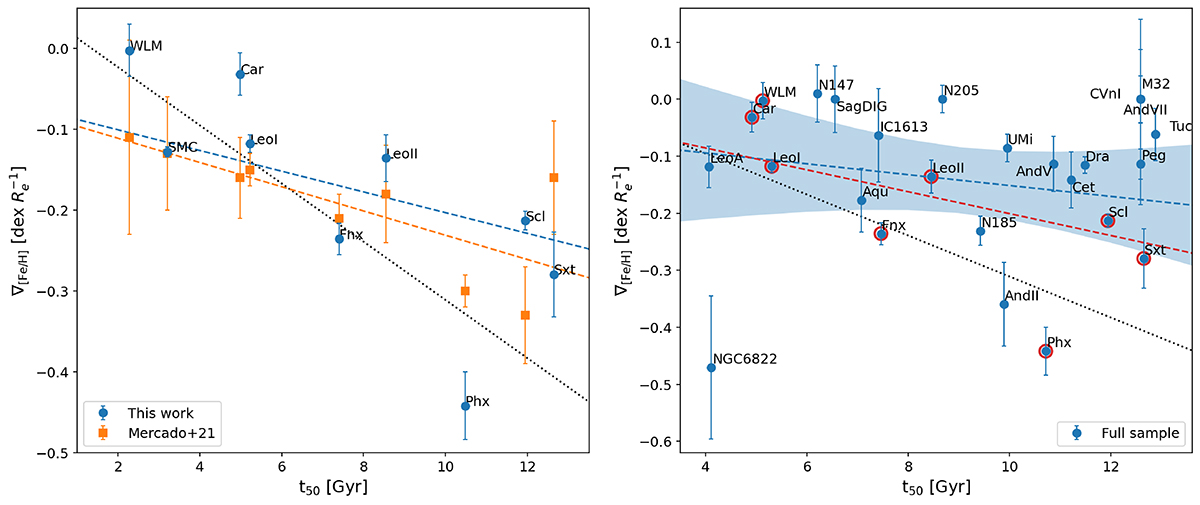
Comparison with Mercado et al. (2021). Left: metallicity gradients as a function of t50 obtained by Mercado et al. (2021) for a sample of LG dwarf galaxies marked by orange squares with error bars, compared with our determinations for the same sample obtained following the Mercado et al. (2021) criteria (i.e. assuming circular radii and with gradients calculated within 2 × Re, circ) marked by blue circles with error bars. The dashed orange and blue lines are the linear LSQ fits to the described samples, respectively, while the dotted black line (in both panels) is the linear relation found by Mercado et al. (2021) for their set of simulated systems. Right: metallicity gradients obtained again following the Mercado et al. (2021) criteria, but for the full sample of galaxies analysed in this work as a function of their t50 adopted from Weisz et al. (2014), Bettinelli et al. (2018) and Albers et al. (2019); the dashed blue line and shaded area are the linear LSQ fit and the associated 95% confidence interval of the sample, respectively. As reference, red circles mark the sub-sample considered by Mercado et al. (2021). The dashed red line is the linear fit to it.
Current usage metrics show cumulative count of Article Views (full-text article views including HTML views, PDF and ePub downloads, according to the available data) and Abstracts Views on Vision4Press platform.
Data correspond to usage on the plateform after 2015. The current usage metrics is available 48-96 hours after online publication and is updated daily on week days.
Initial download of the metrics may take a while.