Fig. 3.
Download original image
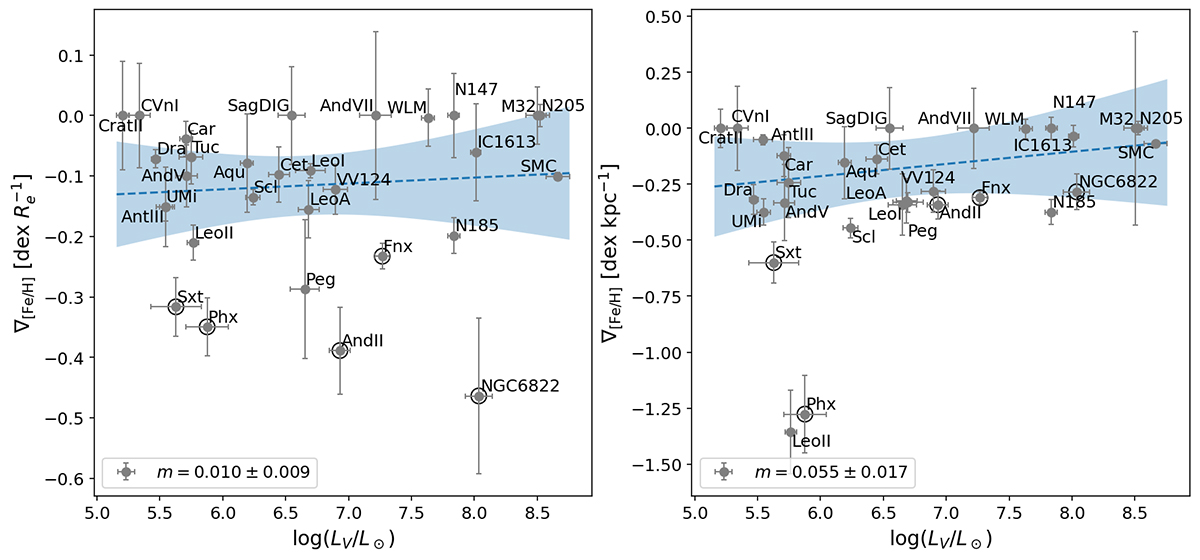
Distribution of metallicity gradients as a function of the galaxy luminosity in V band with the respective uncertainties. The dashed blue lines represent the linear LSQ fit to the data and the blue shaded areas show the 95% confidence interval. In the legend boxes we report the slope value from the LSQ fits. On the y-axes, the left panel shows the metallicity gradients in units of the 2D SMA half-light radius, while on the right panel, they are in units of the physical radius. Dwarf galaxies that may have experienced a past merger event are marked with an open circle.
Current usage metrics show cumulative count of Article Views (full-text article views including HTML views, PDF and ePub downloads, according to the available data) and Abstracts Views on Vision4Press platform.
Data correspond to usage on the plateform after 2015. The current usage metrics is available 48-96 hours after online publication and is updated daily on week days.
Initial download of the metrics may take a while.