Fig. 2.
Download original image
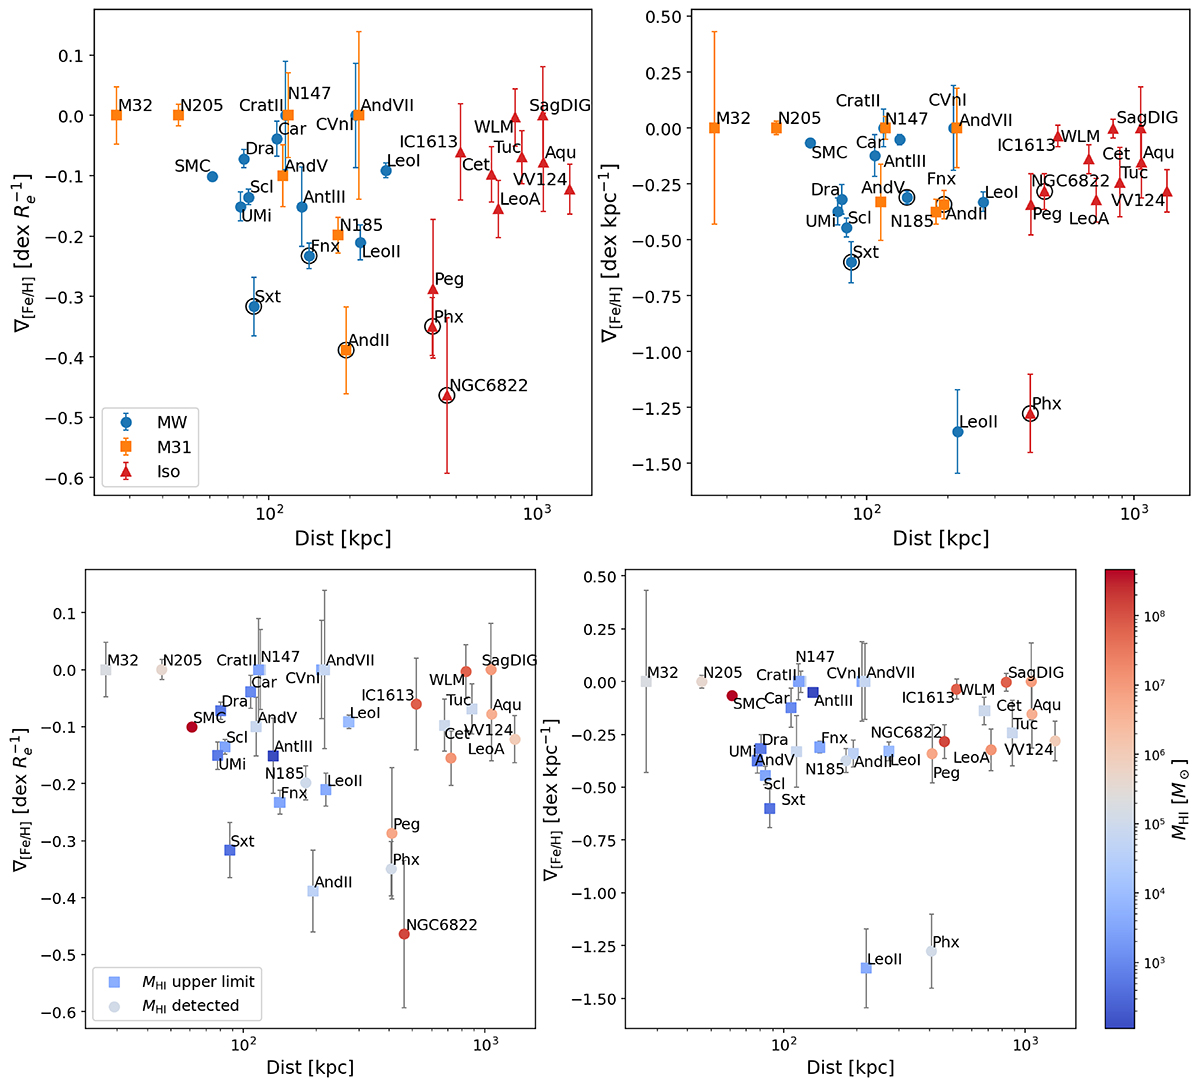
Distribution of metallicity gradients as a function of distance from the nearest large LG spiral. Top: satellites of the Milky Way, M31, and the isolated systems are marked as blue circles, orange squares, and red triangles, respectively. Dwarf galaxies that might have experienced a past merger event are marked with an open circle. Bottom: same as above, but with data colour-coded according to their HI content; circles mark a full detection, and squares mark the 5-σ upper limit (data from Putman et al. 2021, and references therein). On the y-axes, the left panels show the metallicity gradients in units of the 2D SMA half-light radius, and in the right panels, they are in units of the physical radius.
Current usage metrics show cumulative count of Article Views (full-text article views including HTML views, PDF and ePub downloads, according to the available data) and Abstracts Views on Vision4Press platform.
Data correspond to usage on the plateform after 2015. The current usage metrics is available 48-96 hours after online publication and is updated daily on week days.
Initial download of the metrics may take a while.