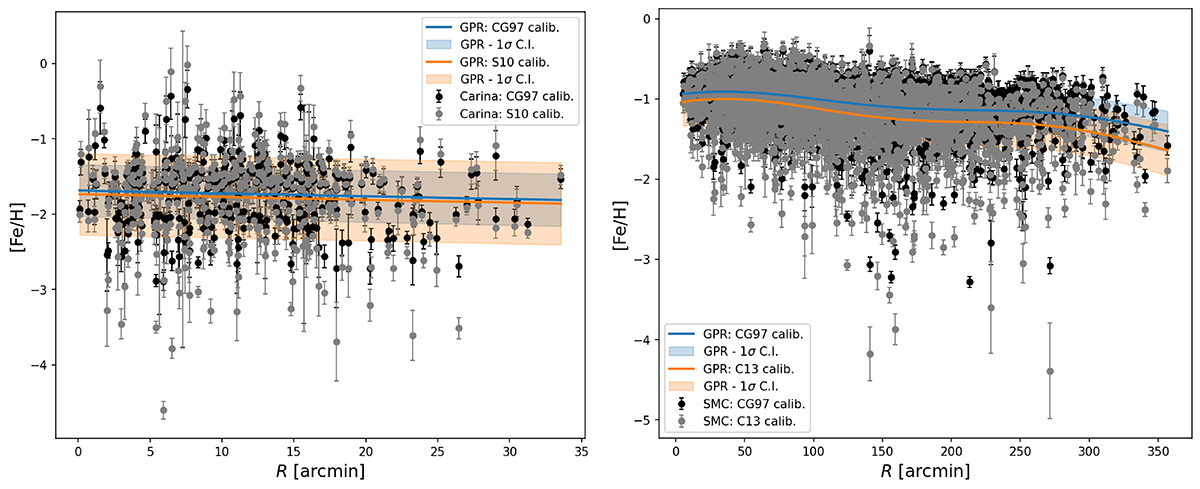
Fig. B.2.
Download original image
Comparison of the individual [Fe/H] measurements as a function of SMA radius for Carina (left) and the SMC (right) between the original values (from Koch et al. 2006 and Dobbie et al. 2014, respectively, in black) calculated using the Carretta & Gratton (1997, CG97) scale, and those applying the Starkenburg et al. (2010, S10) and Carrera et al. (2013, C13) calibrations, respectively (in gray). The blue (orange) solid line and shaded area represent the result of the GPR analysis and the associated 1-σ confidence interval to the original (recalibrated) samples.
Current usage metrics show cumulative count of Article Views (full-text article views including HTML views, PDF and ePub downloads, according to the available data) and Abstracts Views on Vision4Press platform.
Data correspond to usage on the plateform after 2015. The current usage metrics is available 48-96 hours after online publication and is updated daily on week days.
Initial download of the metrics may take a while.