Fig. B.1.
Download original image
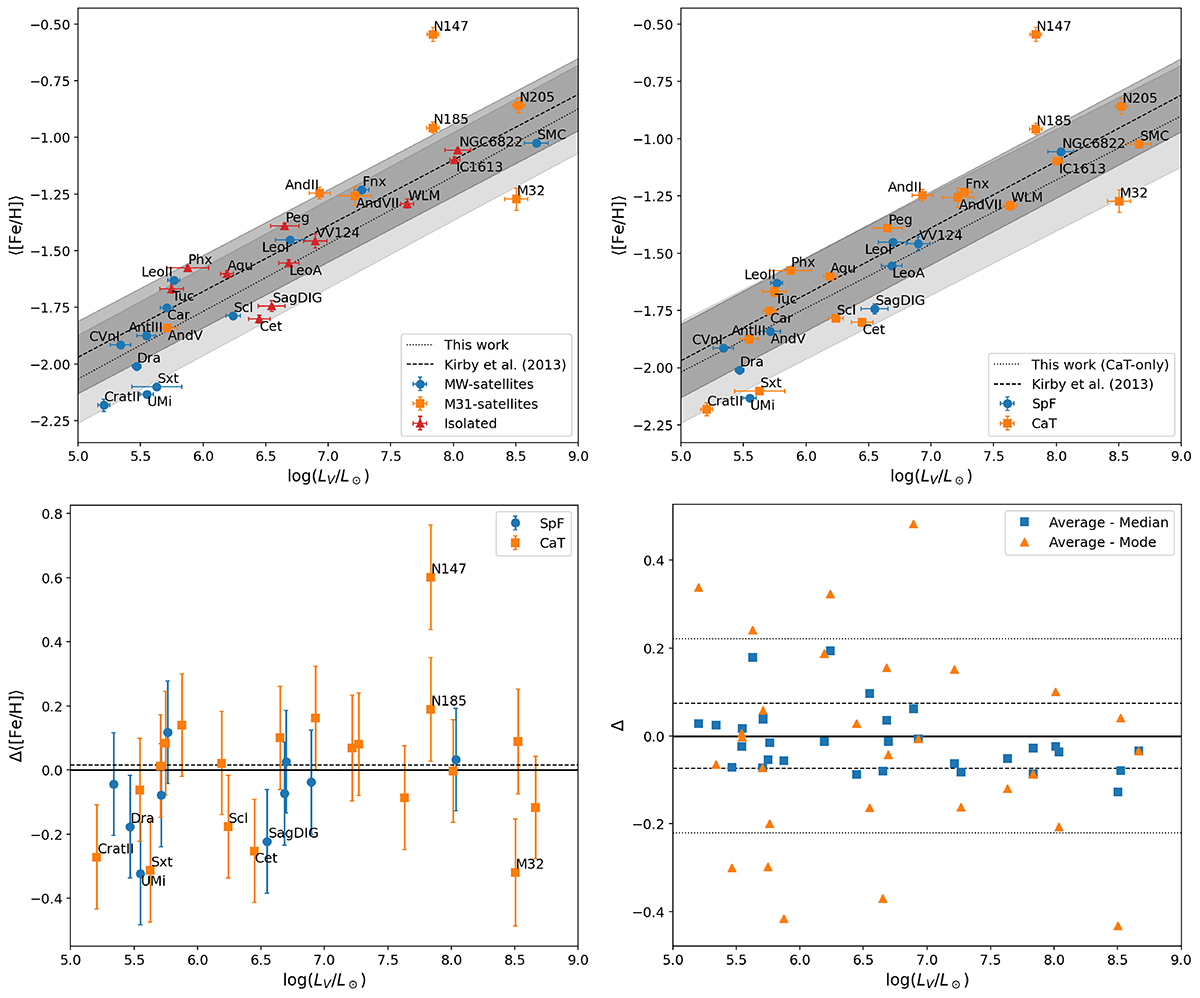
Comparison of the average metallicity properties of our sample of dwarf galaxies. Top left: Stellar luminosity-metallicity diagram; MW (M31) satellites marked with blue circles (orange squares), while isolated systems are shown as red triangles; the linear relation recovered for our sample is indicated by a dotted line and a rms band in light grey, while a dashed line and rms band in dark grey indicate the Kirby et al. (2013b) relation. Top right: Same as the left panel, but with symbols indicating systems whose ⟨[Fe/H]⟩ have been obtained with the CaT calibration method (orange squares) or using a spectral fitting technique (blue circles); the linear relation recovered for the sub-sample using the CaT method is indicated by a dotted line and a rms band in light grey. Bottom left: Difference between the weighted-average ⟨[Fe/H]⟩ of our galaxies and those obtained from the Kirby et al. (2013b) relation at their luminosity; symbols as in the top right panel. Error bars were obtained adding the ⟨[Fe/H]⟩ errors and the rms = 0.16 dex of the Kirby et al. relation in quadrature. The dashed line is the median offset of 0.02 dex for the sub-sample using the CaT-method. Bottom right: Difference between the weighted average and the median (mode) of [Fe/H] distributions marked with blue squares (orange triangles) as a function of luminosity. The dashed (dotted) lines indicate the rms scatter.
Current usage metrics show cumulative count of Article Views (full-text article views including HTML views, PDF and ePub downloads, according to the available data) and Abstracts Views on Vision4Press platform.
Data correspond to usage on the plateform after 2015. The current usage metrics is available 48-96 hours after online publication and is updated daily on week days.
Initial download of the metrics may take a while.