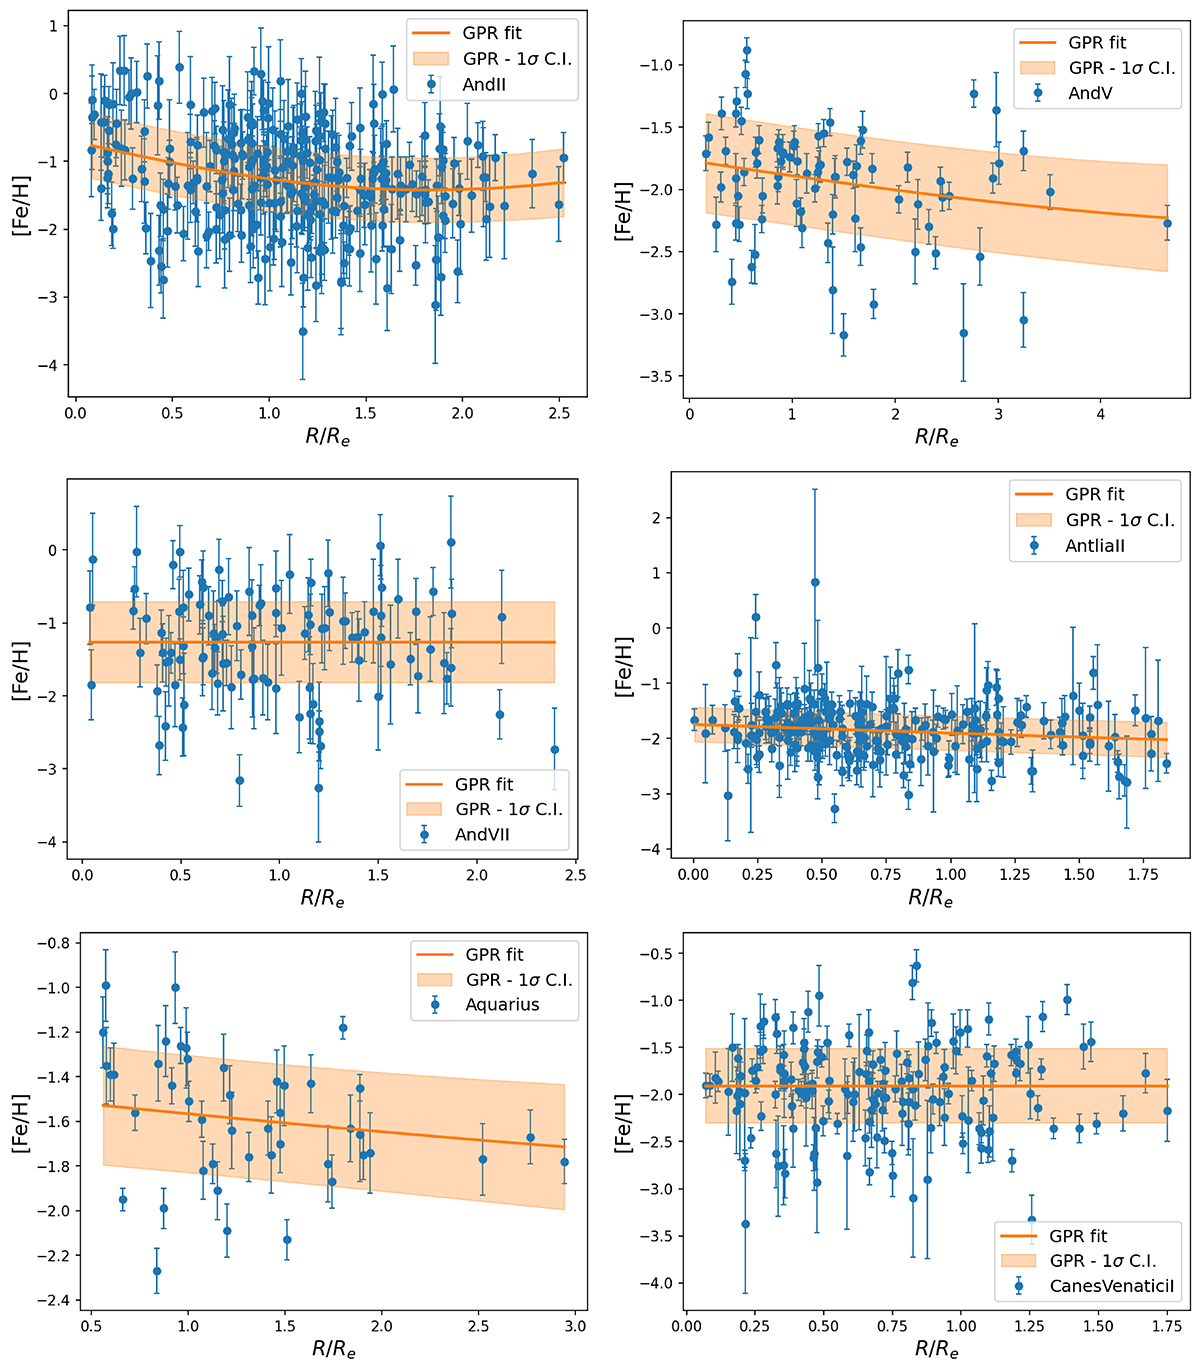
Fig. A.1.
Download original image
Individual [Fe/H] measurements and their errors as a function of SMA radius in units of the 2D half-light radius for the dwarf galaxies. The solid orange line and blue shaded area represent the result of the Gaussian process regression analysis (using a Gaussian kernel) and the associated 1-σ confidence interval. The legend box of each panel reports the name of the corresponding dwarf galaxy.
Current usage metrics show cumulative count of Article Views (full-text article views including HTML views, PDF and ePub downloads, according to the available data) and Abstracts Views on Vision4Press platform.
Data correspond to usage on the plateform after 2015. The current usage metrics is available 48-96 hours after online publication and is updated daily on week days.
Initial download of the metrics may take a while.