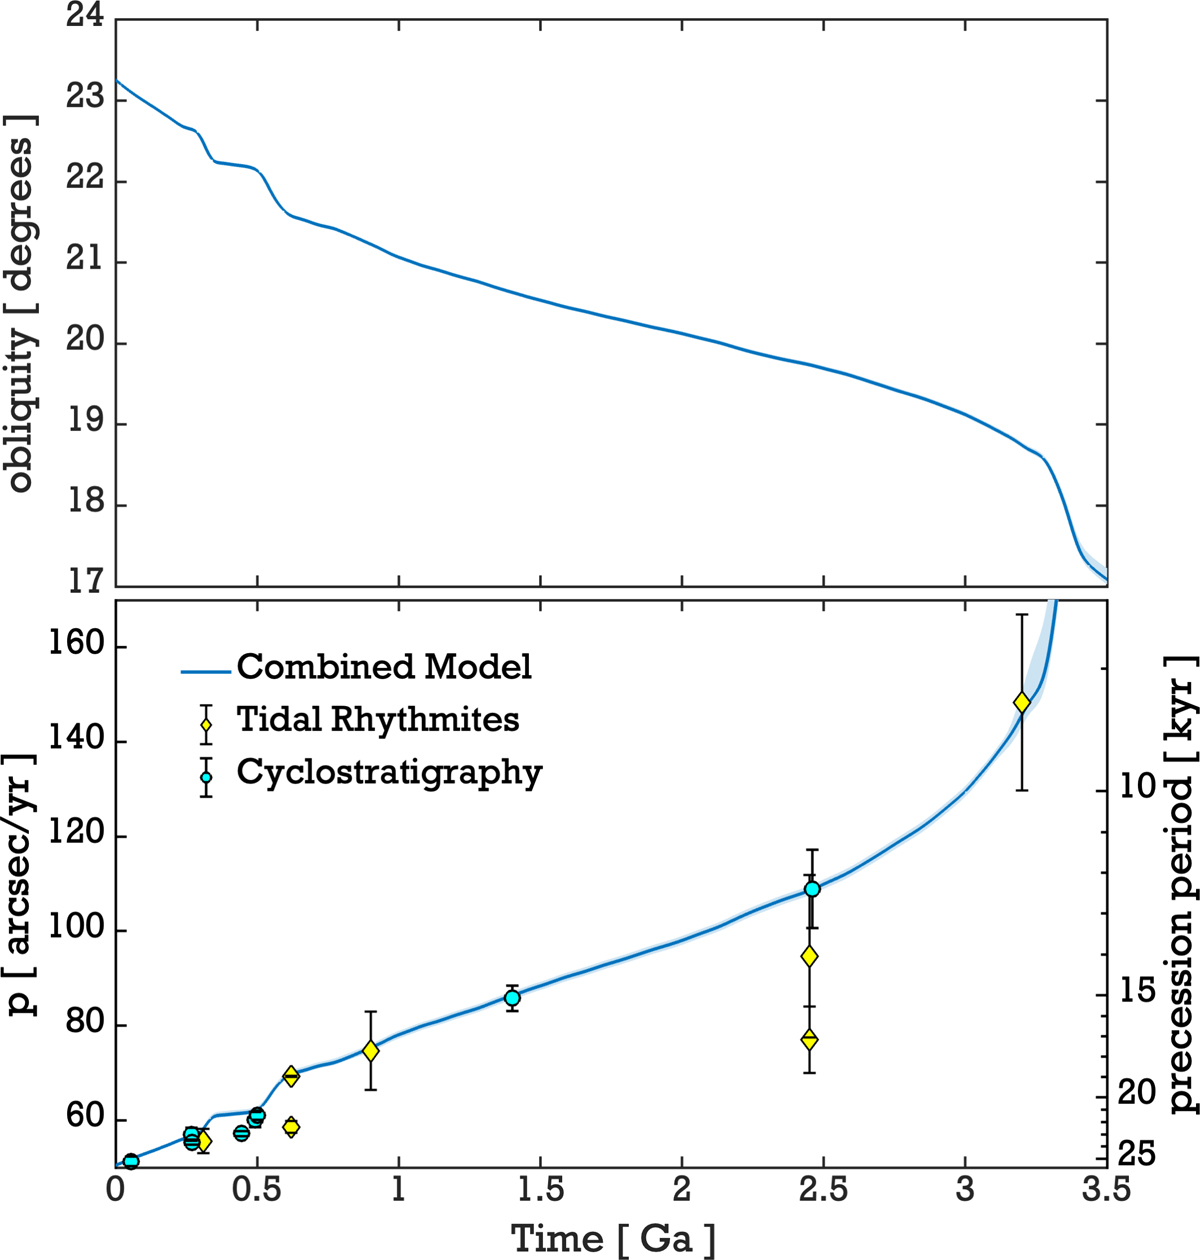
Fig. 6.
Download original image
Evolution of the Earth’s obliquity, precession frequency, and precession period with time. The evolution of aM (Fig. 3) and LOD (Fig. 5) are used to compute the evolution of obliquity and precession by Eqs. (A.6) and (A.7). The geological data of the precession frequency from tidal rhythmites and cyclostratigraphy are also plotted on top of the curve (Tables D.1 and D.2). We note that the precession frequency is the directly measured observable in cyclostratigraphy.
Current usage metrics show cumulative count of Article Views (full-text article views including HTML views, PDF and ePub downloads, according to the available data) and Abstracts Views on Vision4Press platform.
Data correspond to usage on the plateform after 2015. The current usage metrics is available 48-96 hours after online publication and is updated daily on week days.
Initial download of the metrics may take a while.