Fig. 4.
Download original image
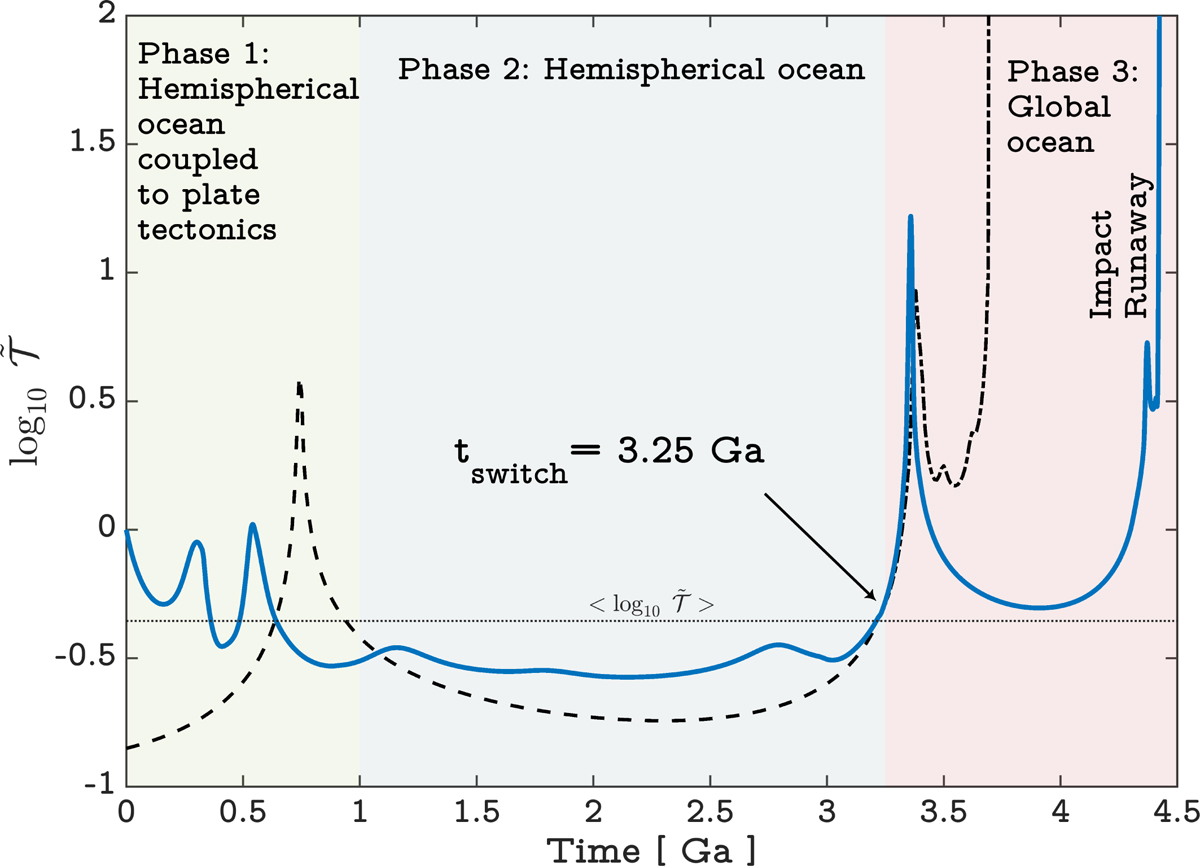
History of the tidal torque. The logarithm of the semi-diurnal tidal torque of the Earth (normalized by its present value: ![]() ) is plotted as a function of time. The solid curve corresponds to the torque of the combined model that involves three phases: in the first phase, a hemispherical ocean migrates on the surface of the Earth following the evolution of the continental barycenter of Fig. 1. Given we lack a continuous plate tectonics model beyond 1 Ga, in Phase 2, we fix the hemispherical ocean to its configuration at 1 Ga to avoid discontinuities in the modeling. It is noteworthy that the attenuated tidal torque over this phase is not due to the fixed oceanic position but due to the tidal response occupying the non-resonant background of the spectrum for the tidal frequencies associated with this interval. Beyond tswitch, we enter Phase 3 of the model with the global ocean configuration. The dashed and dashed-dotted curves correspond, respectively, to the global and hemispherical oceanic torques that are ignored over the specified intervals by the selective combined model.
) is plotted as a function of time. The solid curve corresponds to the torque of the combined model that involves three phases: in the first phase, a hemispherical ocean migrates on the surface of the Earth following the evolution of the continental barycenter of Fig. 1. Given we lack a continuous plate tectonics model beyond 1 Ga, in Phase 2, we fix the hemispherical ocean to its configuration at 1 Ga to avoid discontinuities in the modeling. It is noteworthy that the attenuated tidal torque over this phase is not due to the fixed oceanic position but due to the tidal response occupying the non-resonant background of the spectrum for the tidal frequencies associated with this interval. Beyond tswitch, we enter Phase 3 of the model with the global ocean configuration. The dashed and dashed-dotted curves correspond, respectively, to the global and hemispherical oceanic torques that are ignored over the specified intervals by the selective combined model.
Current usage metrics show cumulative count of Article Views (full-text article views including HTML views, PDF and ePub downloads, according to the available data) and Abstracts Views on Vision4Press platform.
Data correspond to usage on the plateform after 2015. The current usage metrics is available 48-96 hours after online publication and is updated daily on week days.
Initial download of the metrics may take a while.