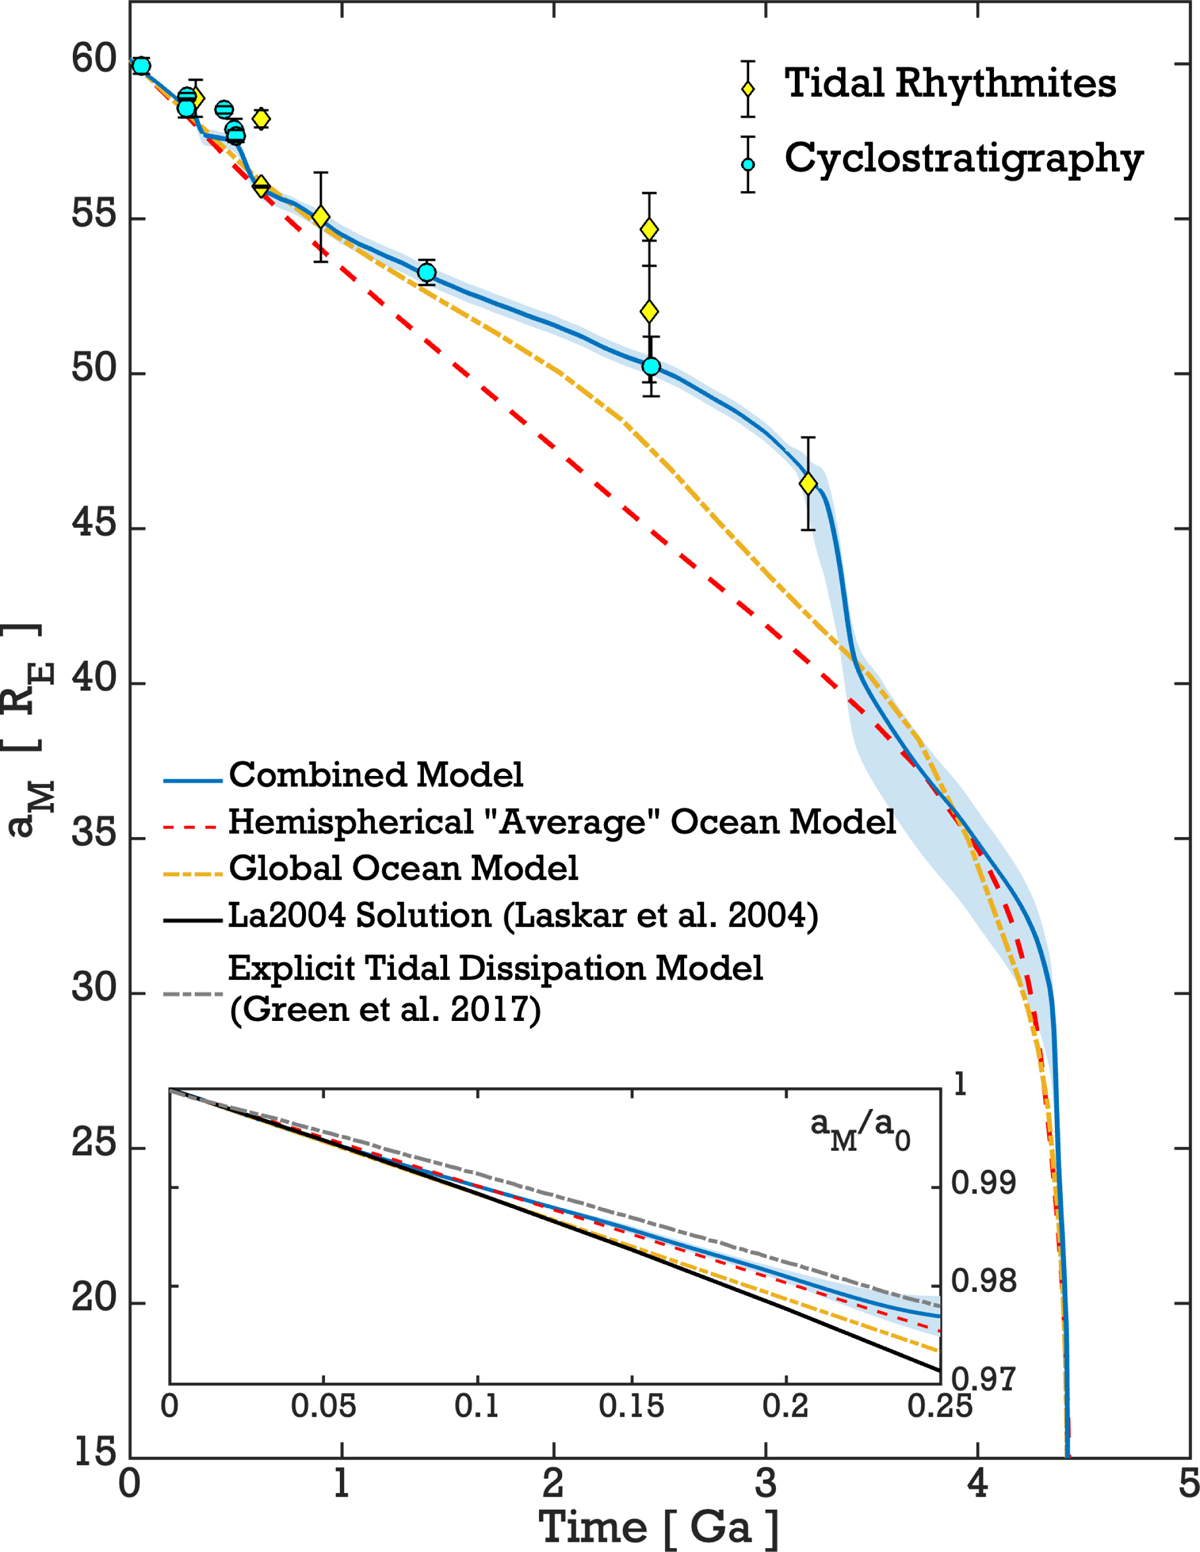
Fig. 3.
Download original image
Evolution of the lunar semi-major axis over time. The Earth-Moon separation, aM, is plotted for the three studied models, taking the best-fit values of the free parameters (H, σR) as described in Fig. 2 and in the main text. Plotted on top of the evolution curves: Geological inferences of aM from cyclostratigraphy and tidal laminae data (Tables D.1 and D.2). The shaded envelope corresponds to 2σ-uncertainty in the fitted parameters of the combined model (Appendix C). In the narrow window, we zoom over the most recent 250 Myr of the evolution and make a comparison with the evolution corresponding to explicit numerical tidal modeling using paleogeographic reconstructions (Green et al. 2017) and the prediction of the numerical solution La2004 (Laskar et al. 2004). We note that the integration of aE extends to 3RE, but the y-axis is trimmed to start at 15RE for a better visualization of the geological data.
Current usage metrics show cumulative count of Article Views (full-text article views including HTML views, PDF and ePub downloads, according to the available data) and Abstracts Views on Vision4Press platform.
Data correspond to usage on the plateform after 2015. The current usage metrics is available 48-96 hours after online publication and is updated daily on week days.
Initial download of the metrics may take a while.