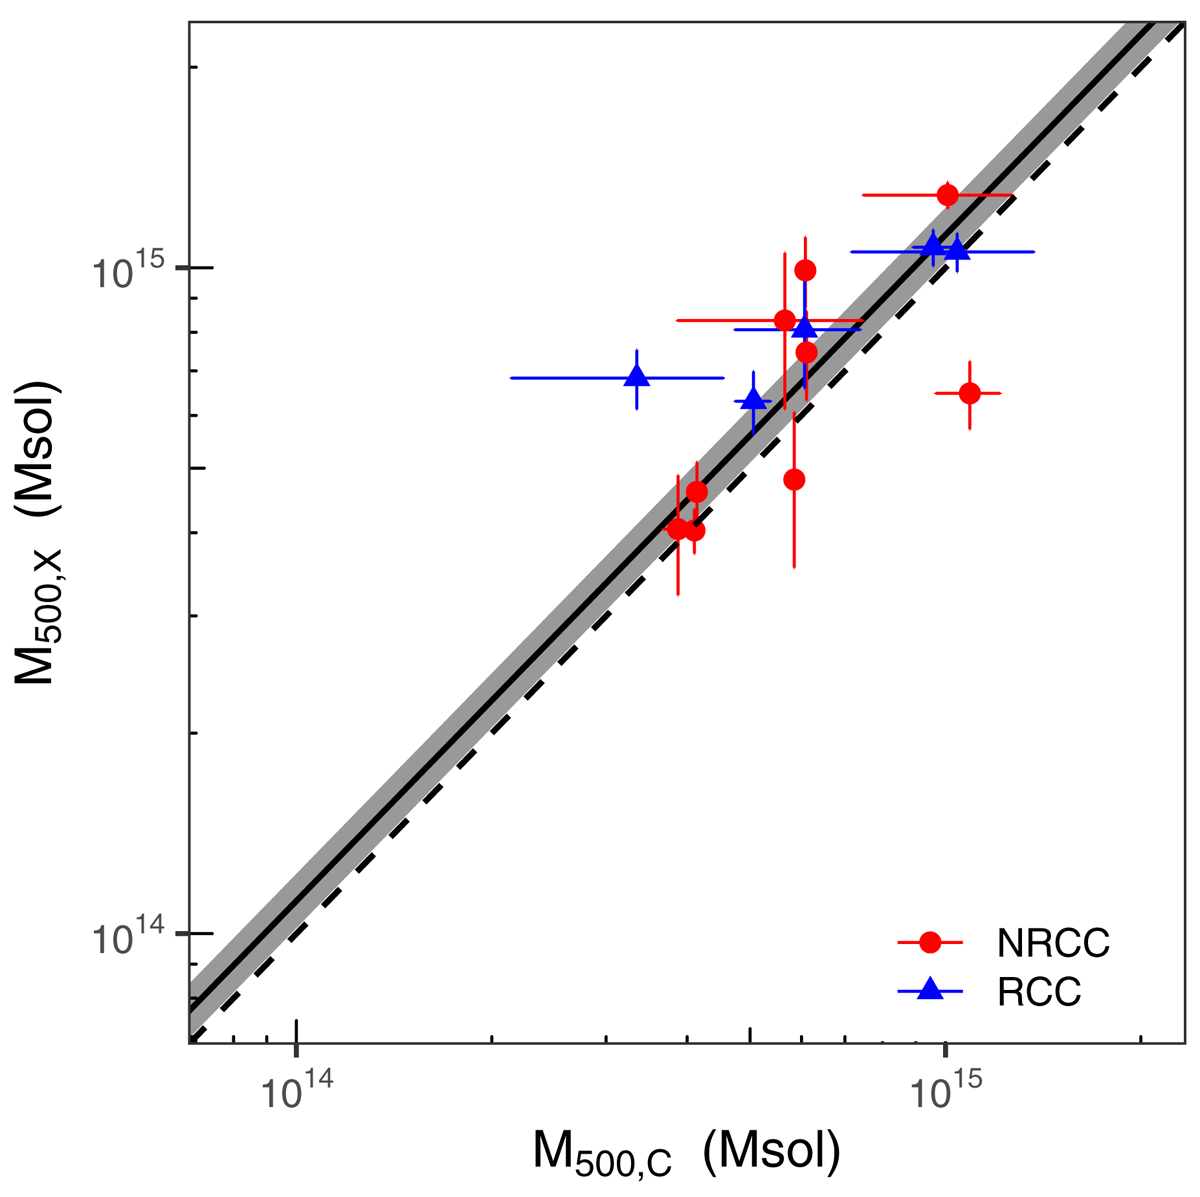
Fig. 9.
Download original image
We show the hydrostatic masses versus the caustic masses for the 14 clusters in our sample with the highest Ngal values, both calculated at the hydrostatic R500. We show RCC clusters as blue triangles and NRCC clusters as red circles. The solid black line shows the best fitting model, with the shaded region indicating the 1σ uncertainty. The 1:1 line is also plotted as a dashed black line.
Current usage metrics show cumulative count of Article Views (full-text article views including HTML views, PDF and ePub downloads, according to the available data) and Abstracts Views on Vision4Press platform.
Data correspond to usage on the plateform after 2015. The current usage metrics is available 48-96 hours after online publication and is updated daily on week days.
Initial download of the metrics may take a while.