Fig. 8.
Download original image
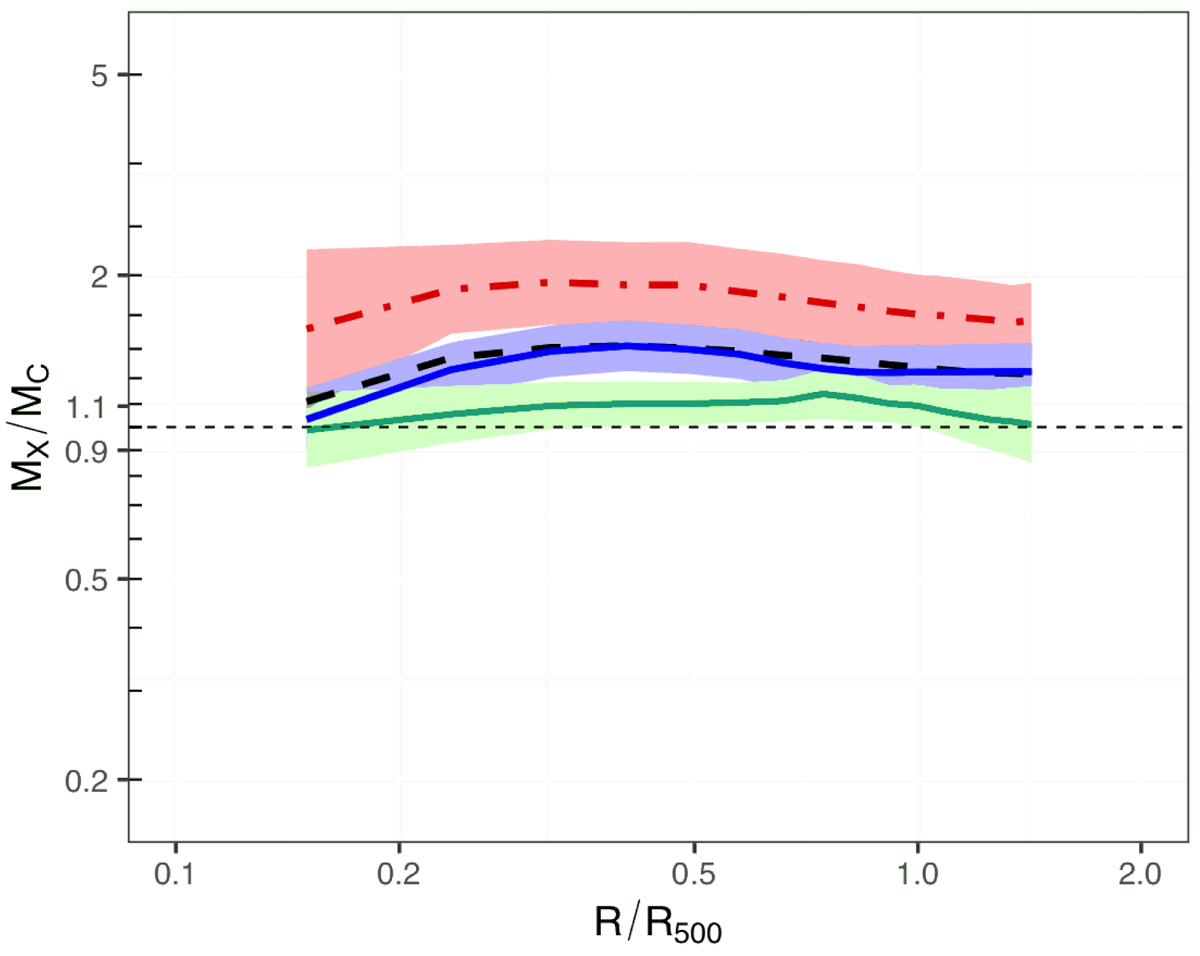
The average MX/MC profiles for the high Ngal, mid Ngal and low Ngal clusters in green lines, blue lines, and red dot-dashed lines respectively. The 1:1 line is also plotted as a thin black dashed line. The thick dashed black line shows the average MX/MC profile for all clusters. The profiles are scaled in radius by the hydrostatic R500, and the shaded regions show the 1σ uncertainties.
Current usage metrics show cumulative count of Article Views (full-text article views including HTML views, PDF and ePub downloads, according to the available data) and Abstracts Views on Vision4Press platform.
Data correspond to usage on the plateform after 2015. The current usage metrics is available 48-96 hours after online publication and is updated daily on week days.
Initial download of the metrics may take a while.