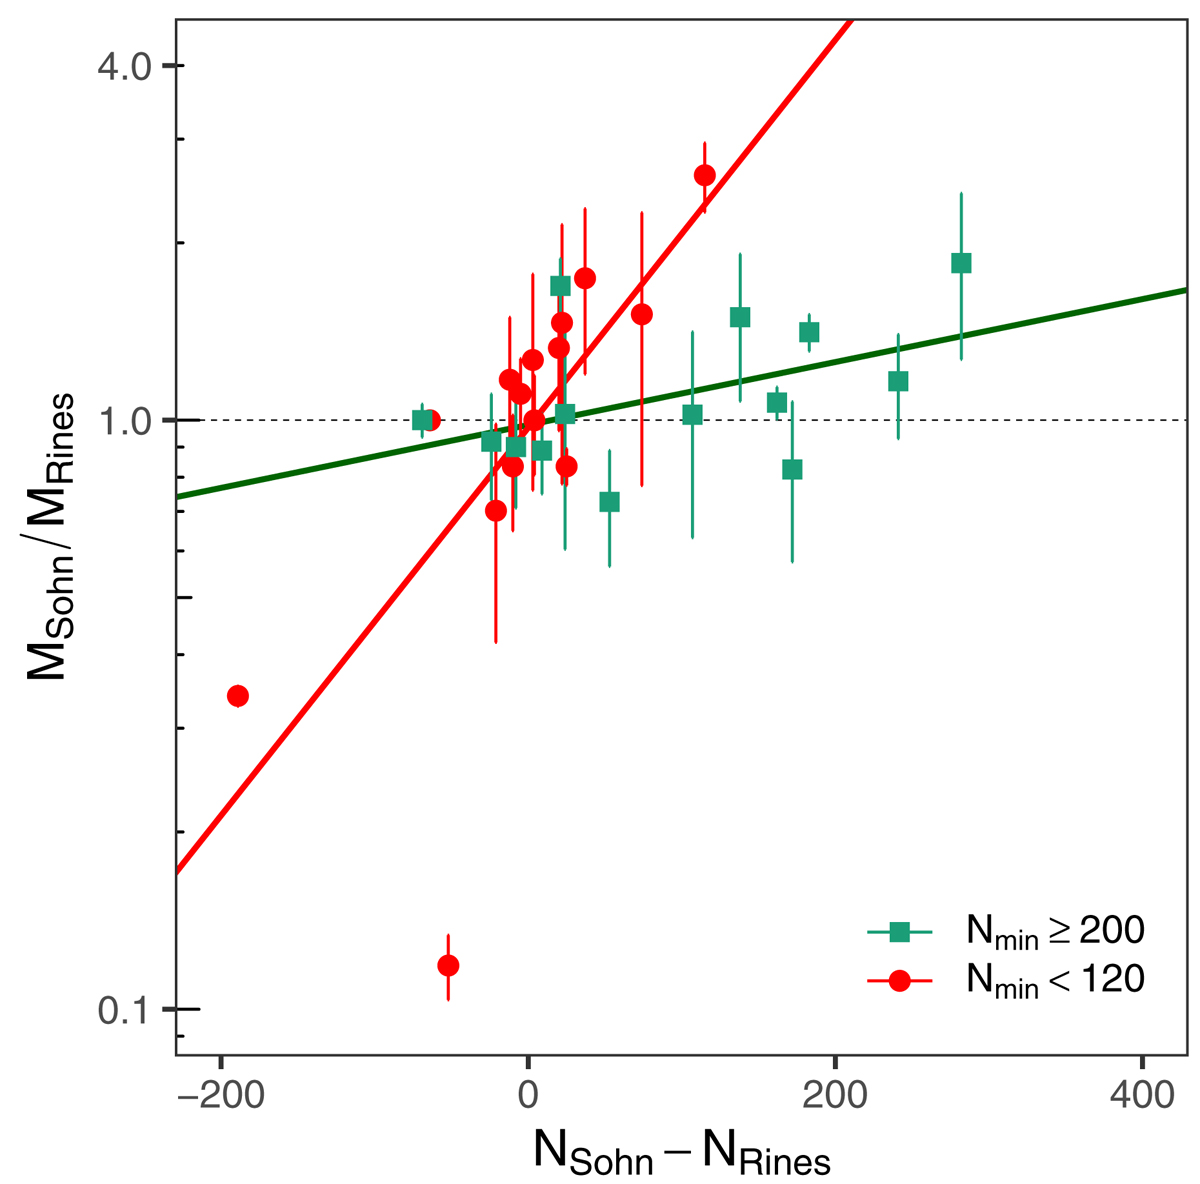
Fig. 7.
Download original image
The ratio of the caustic masses (measured at the hydrostatic R500) from Sohn et al. (2020) to those from Rines et al. (2013) are plotted as a function of the difference in Ngal between the analyses. The clusters are split into subsets containing those where the minimum Ngal used in the two analyses was at least 200 (green squares) and those where the minimum Ngal was less then 120 (red circles). The lines show the best fits to each subset.
Current usage metrics show cumulative count of Article Views (full-text article views including HTML views, PDF and ePub downloads, according to the available data) and Abstracts Views on Vision4Press platform.
Data correspond to usage on the plateform after 2015. The current usage metrics is available 48-96 hours after online publication and is updated daily on week days.
Initial download of the metrics may take a while.