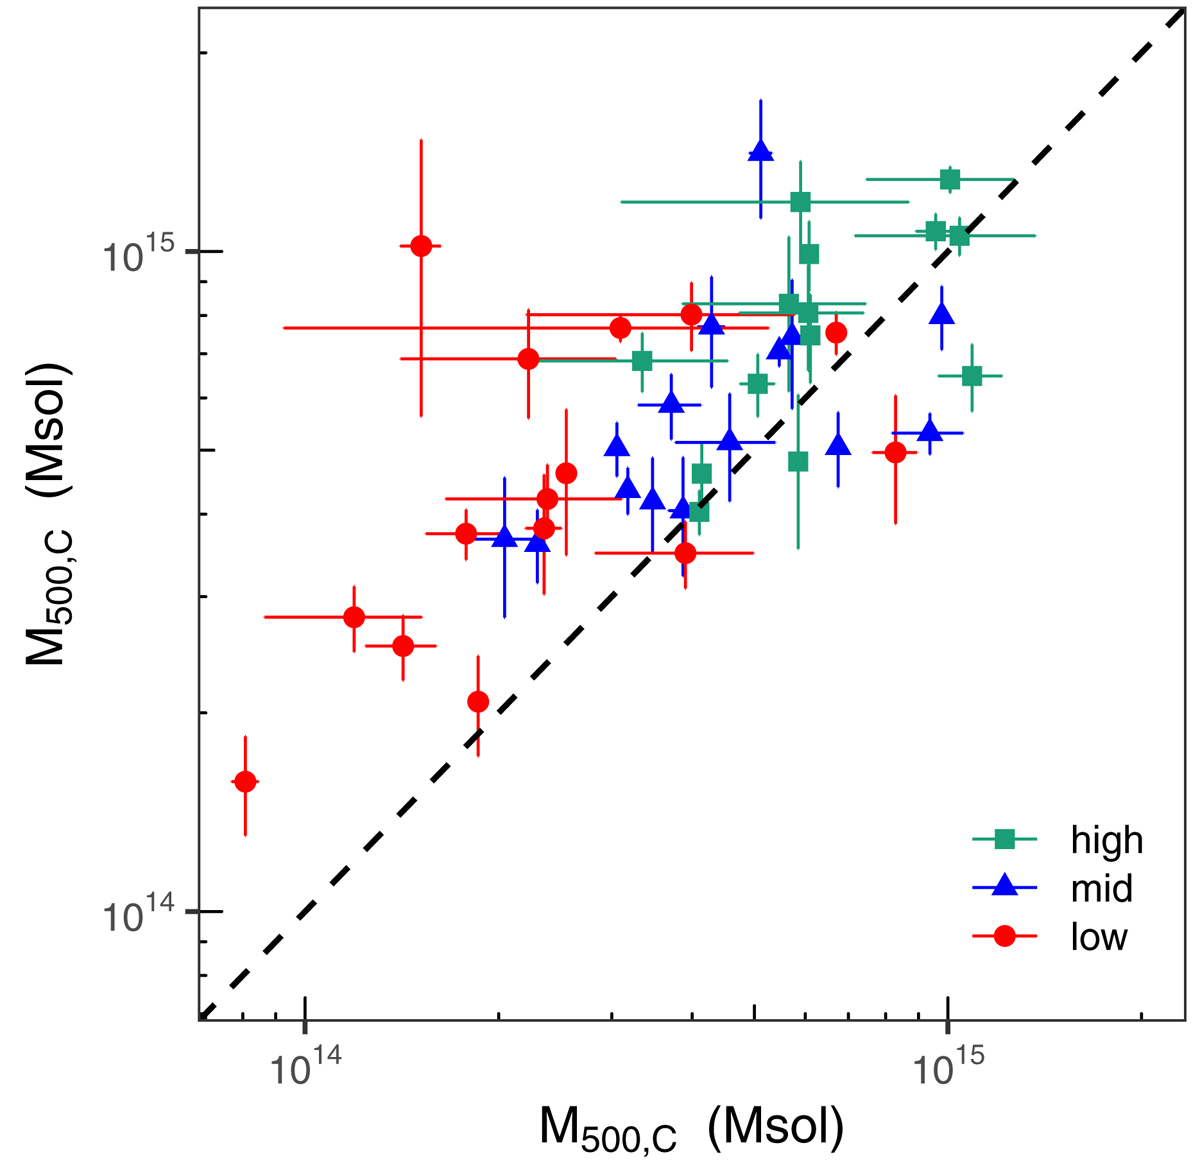
Fig. 5.
Download original image
The hydrostatic and caustic masses measured within the hydrostatic R500 are plotted for the full sample. This is the same data as plotted in Fig. 2, but now showing the Ngal subsets. The high, mid and low Ngal bins are green squares, blue triangles and red circles respectively. The 1:1 line is also plotted as a dashed black line.
Current usage metrics show cumulative count of Article Views (full-text article views including HTML views, PDF and ePub downloads, according to the available data) and Abstracts Views on Vision4Press platform.
Data correspond to usage on the plateform after 2015. The current usage metrics is available 48-96 hours after online publication and is updated daily on week days.
Initial download of the metrics may take a while.