Fig. 4.
Download original image
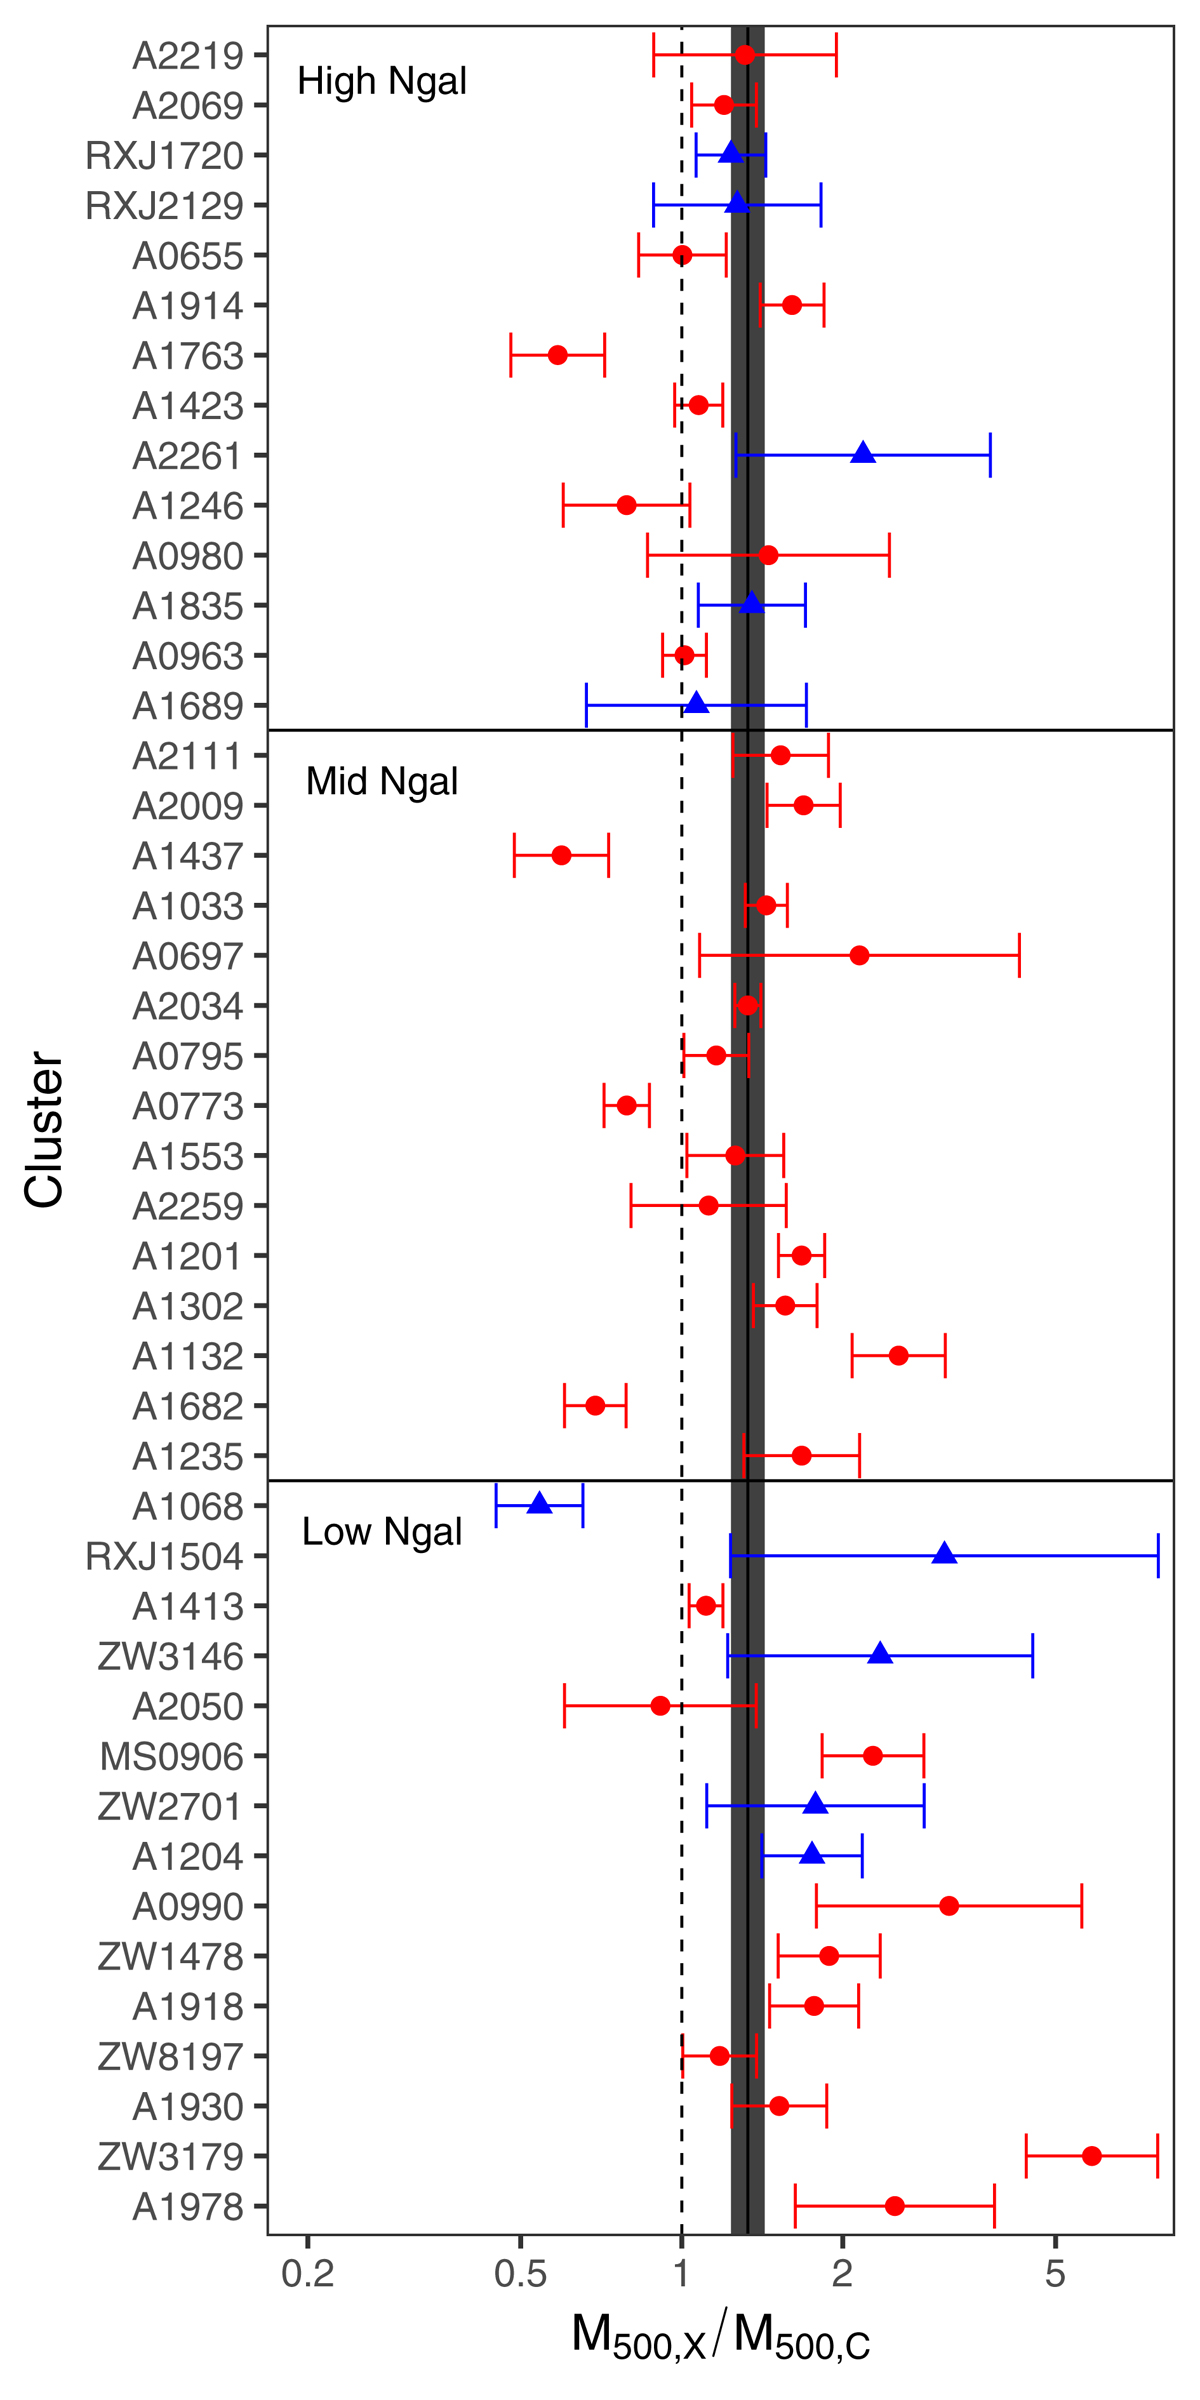
We show the M500, X/M500, C ratio for all 44 clusters in our sample. NRCC clusters are red circles and RCC clusters are blue triangles. The solid black line and shaded region show the average M500, X/M500, C ratio at the hydrostatic R500. 1σ errors are shown. The clusters are ranked by Ngal with the highest at the top, and the horizontal lines separate the clusters into the low, mid and high Ngal subsets (see Sect. 4.2).
Current usage metrics show cumulative count of Article Views (full-text article views including HTML views, PDF and ePub downloads, according to the available data) and Abstracts Views on Vision4Press platform.
Data correspond to usage on the plateform after 2015. The current usage metrics is available 48-96 hours after online publication and is updated daily on week days.
Initial download of the metrics may take a while.