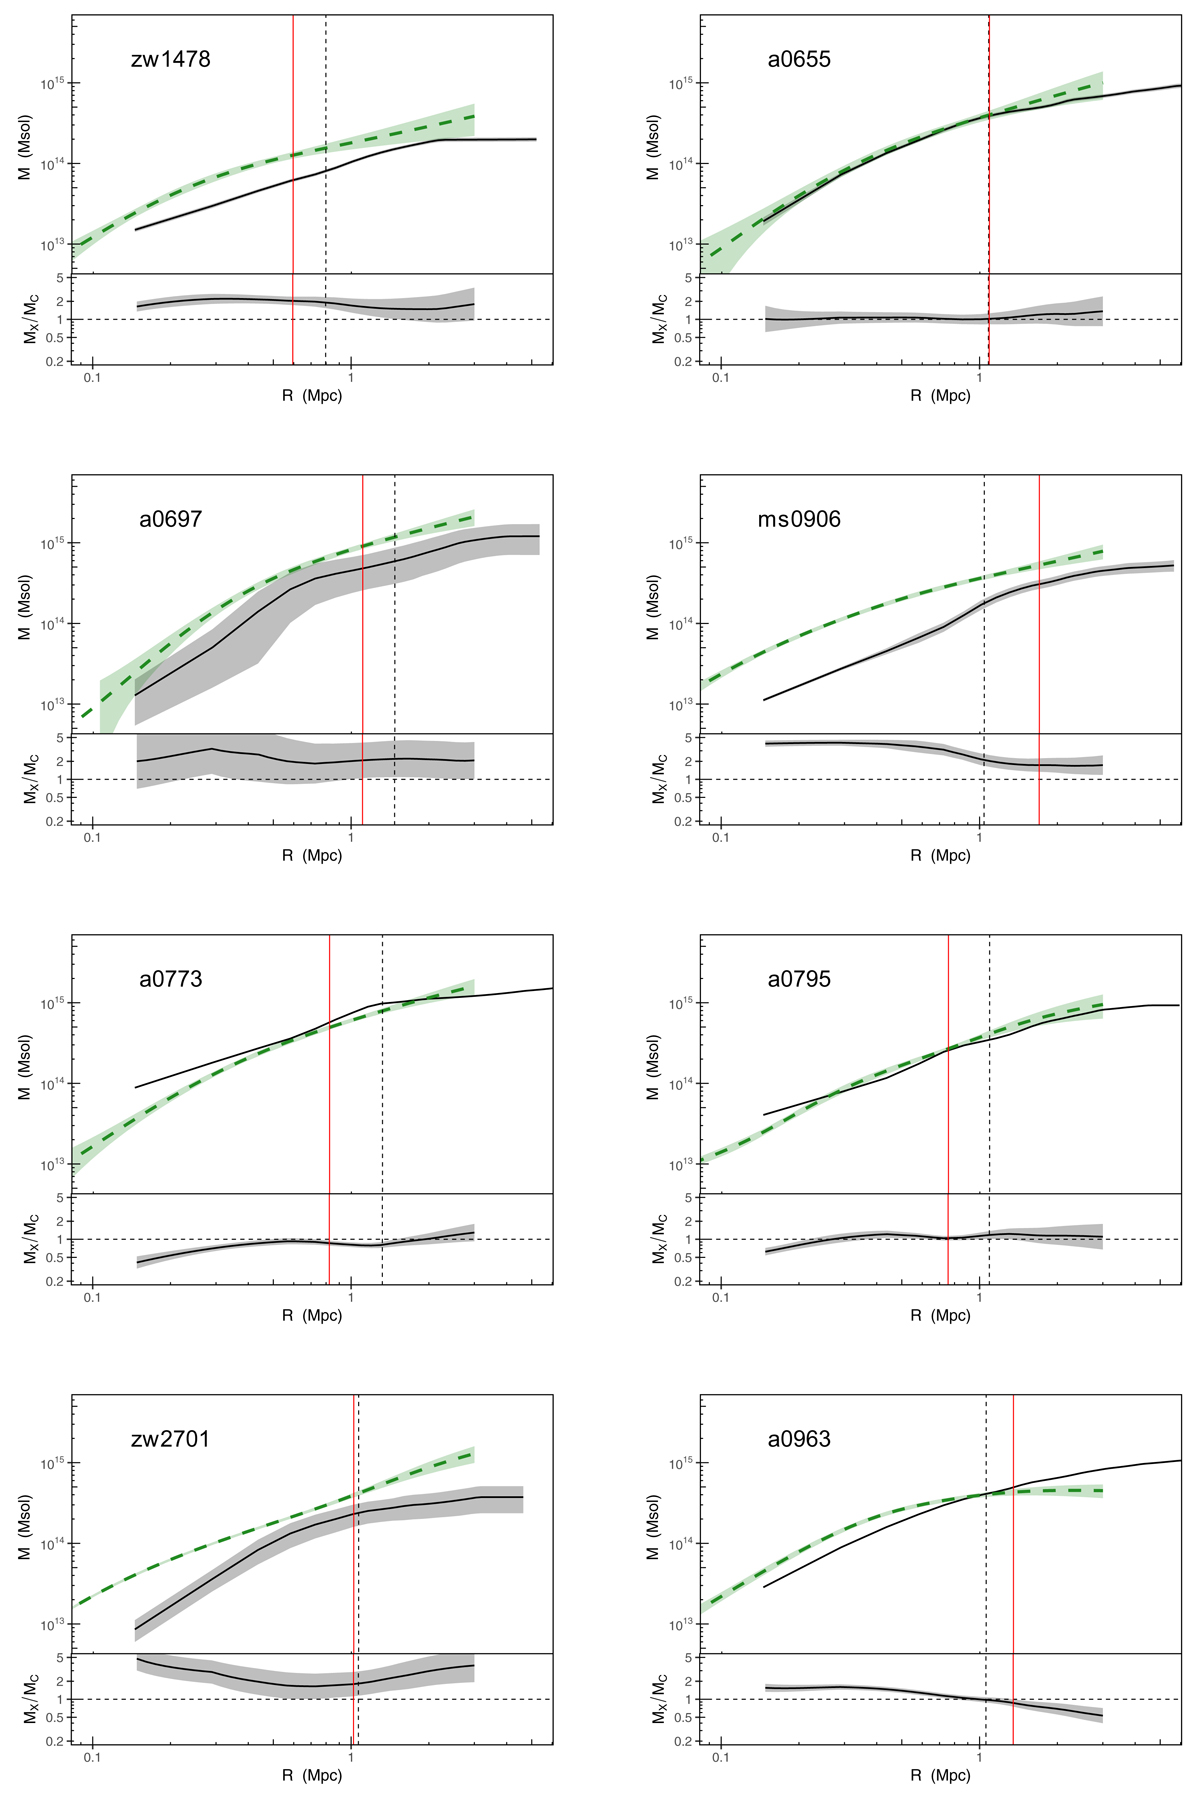
Fig. C.1.
Download original image
The caustic and hydrostatic mass profiles for each cluster as black solid and green dashed lines respectively in the upper panels of each plot. The ratio of the hydrostatic to caustic mass, MX/MC, are shown in the lower panels of each plot. 1σ uncertainties are shown by the shaded regions. The vertical black line is at the value of R500 as calculated from the hydrostatic mass profile; the solid red vertical line is at the outer radius of the measured temperature profile (note that hydrostatic masses beyond this radius are based on extrapolation).
Current usage metrics show cumulative count of Article Views (full-text article views including HTML views, PDF and ePub downloads, according to the available data) and Abstracts Views on Vision4Press platform.
Data correspond to usage on the plateform after 2015. The current usage metrics is available 48-96 hours after online publication and is updated daily on week days.
Initial download of the metrics may take a while.