Open Access
Fig. 4.
Download original image
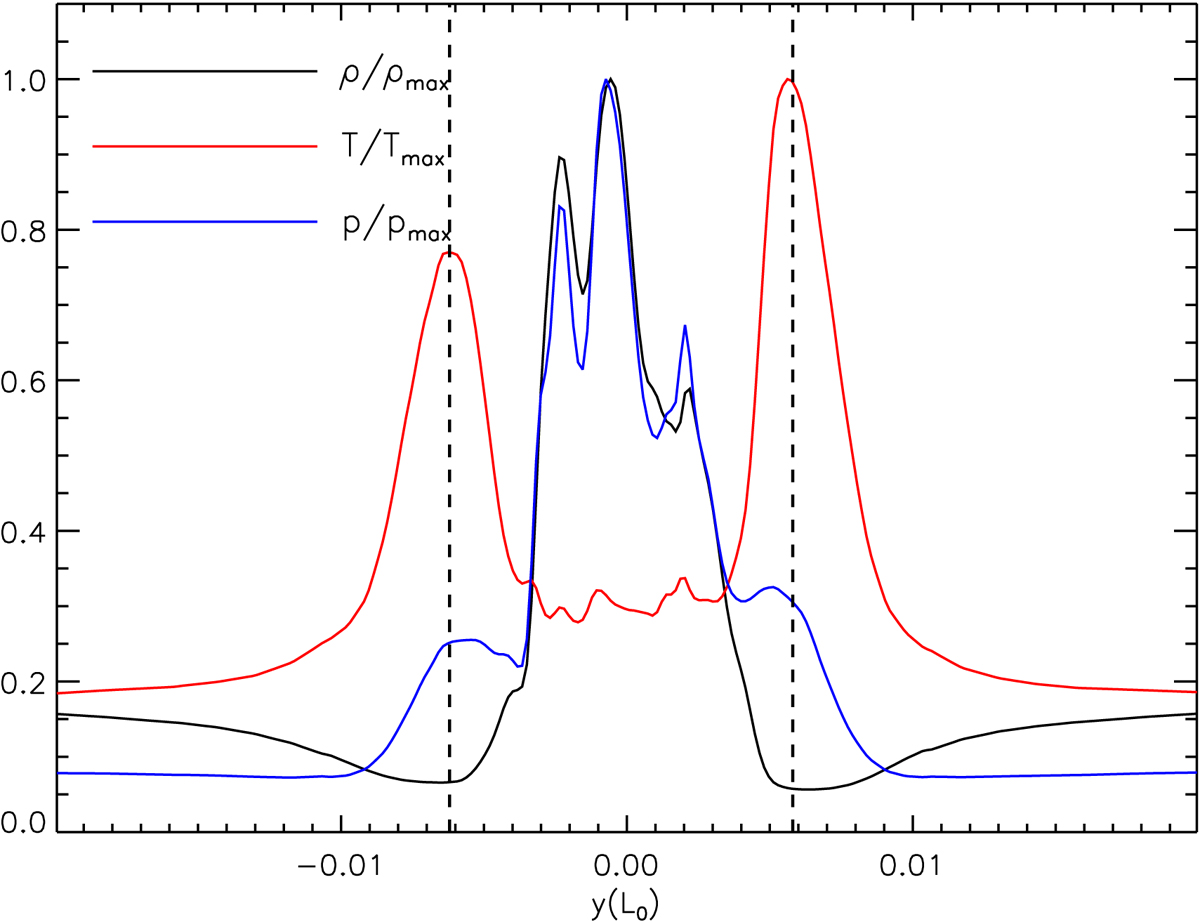
Distributions of the mass density (ρ/ρmax), temperature (T/Tmax), and pressure (p/pmax) along the white dashed-dotted line as shown on the bottom panel of Figs. 2a and 3a; ρmax = 8.36 × 10⁻⁶ kg m−3, Tmax = 24 504 K, and pmax = 494.55 N m−2 are the maximum values of mass density, temperature, and pressure along this line.
Current usage metrics show cumulative count of Article Views (full-text article views including HTML views, PDF and ePub downloads, according to the available data) and Abstracts Views on Vision4Press platform.
Data correspond to usage on the plateform after 2015. The current usage metrics is available 48-96 hours after online publication and is updated daily on week days.
Initial download of the metrics may take a while.