Fig. 9.
Download original image
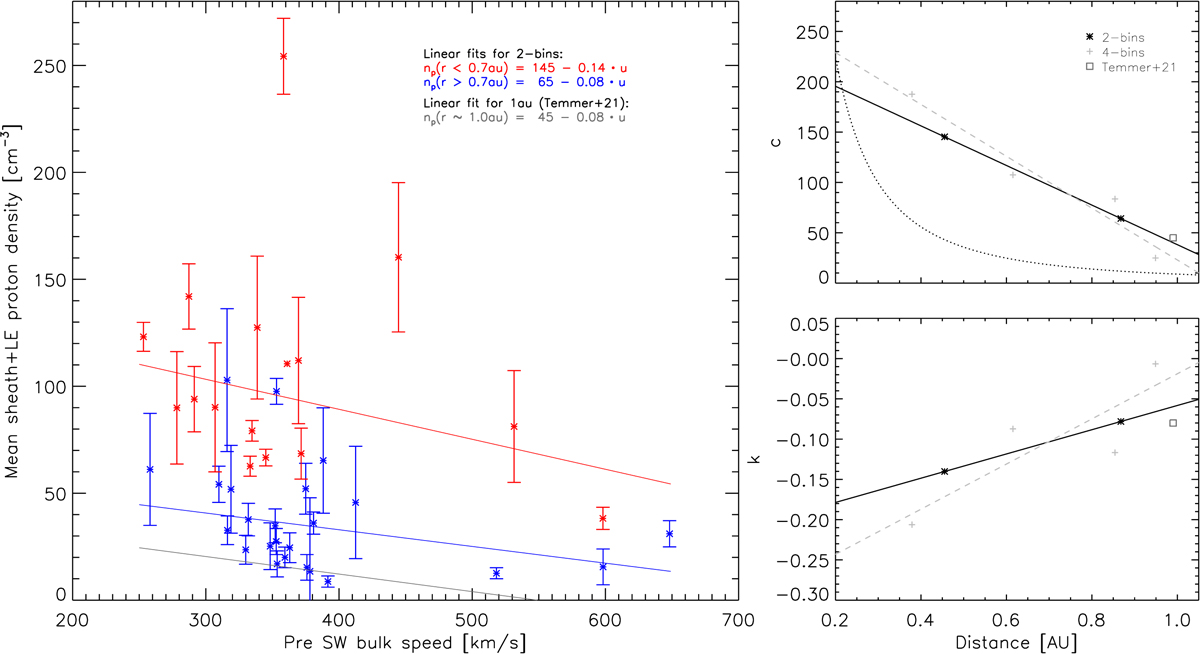
Linear fits for the relation between sheath+LE structure density and the upstream solar wind speed at different distances from the Sun. Left: average density, np, and upstream solar wind speed, u, for two distance bins (red: r1 < 0.7 au covering 16 events; blue: r2 > 0.70 au covering 24 events). Right: constants (top) and slope (bottom) for the fits from the two-bin distribution, as given on the left, as well as for a four-bin distribution (r1, 2, 3, 4 = [0.3–0.47, 0.47–0.75, 0.79–0.92, 0.92–0.98]). In addition, we give the results from Temmer et al. (2021), who derived a linear relation between the upstream solar wind speed and sheath density for 1 au for a sample of 29 events. We show a linear fit for each sample and give the resulting regression formula in the legend.
Current usage metrics show cumulative count of Article Views (full-text article views including HTML views, PDF and ePub downloads, according to the available data) and Abstracts Views on Vision4Press platform.
Data correspond to usage on the plateform after 2015. The current usage metrics is available 48-96 hours after online publication and is updated daily on week days.
Initial download of the metrics may take a while.