Fig. 7.
Download original image
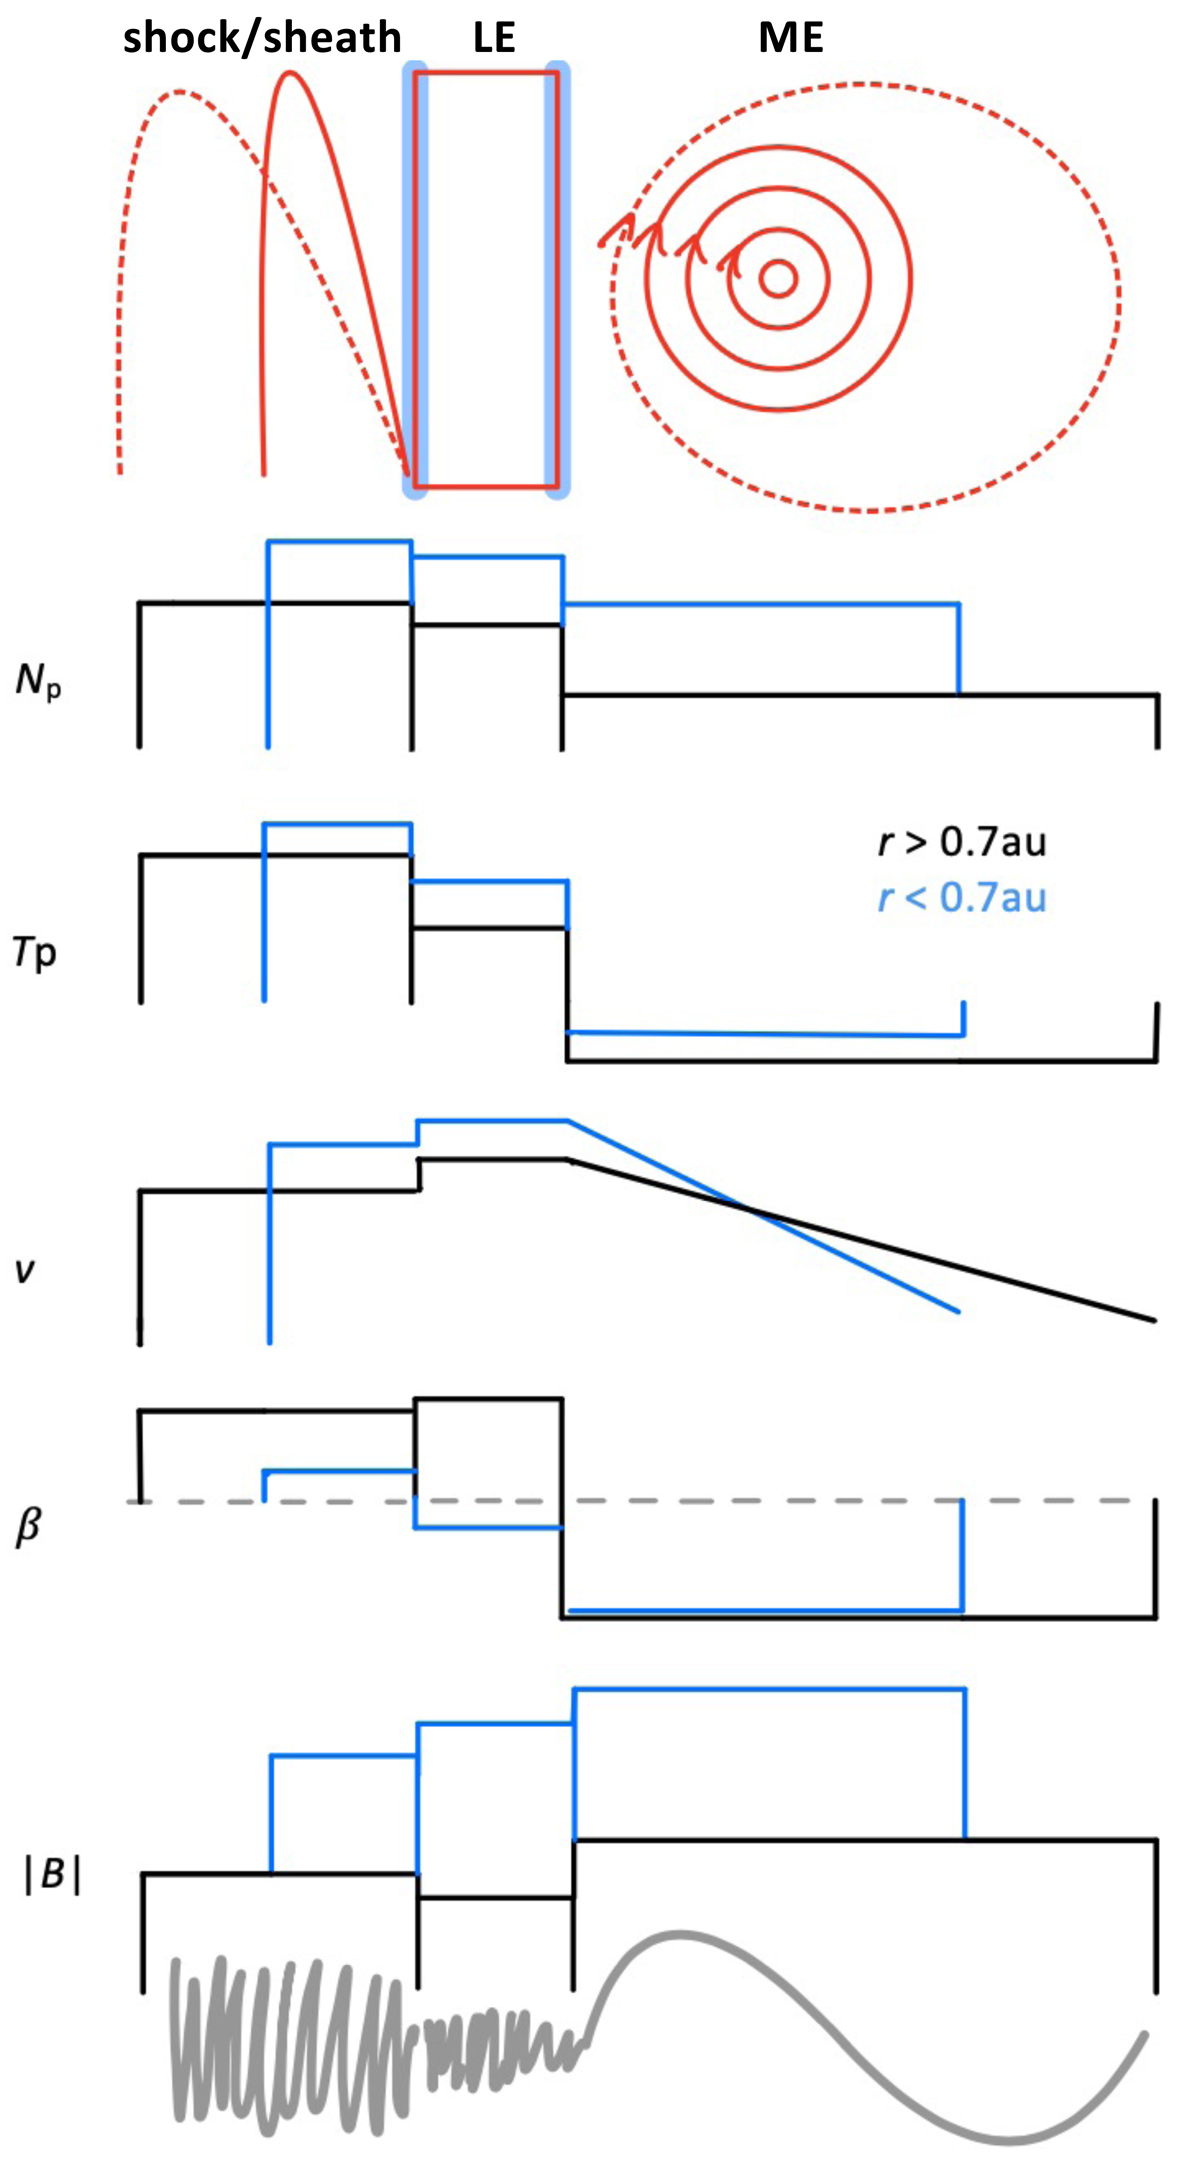
Cartoon illustrating the four different ICME structures and their relative parameter values. Top panel: discontinuities are marked as blue shaded areas before and after the LE, the expansion of the sheath and ME is marked with dotted red lines. Lower panels: particle density (Np), temperature (Tp), speed (v), plasma-beta (β) and total magnetic field strength (B) with magnetic field variations from very fluctuating to smoothly rotating depicted below. For statistical reasons we derived the values for two different distance ranges and sketch the change in the average values accordingly (r < 0.7 au in blue and r > 0.7 au in black). For the actual average values and minimum/maximum ranges see Table 2.
Current usage metrics show cumulative count of Article Views (full-text article views including HTML views, PDF and ePub downloads, according to the available data) and Abstracts Views on Vision4Press platform.
Data correspond to usage on the plateform after 2015. The current usage metrics is available 48-96 hours after online publication and is updated daily on week days.
Initial download of the metrics may take a while.