Fig. 4
Download original image
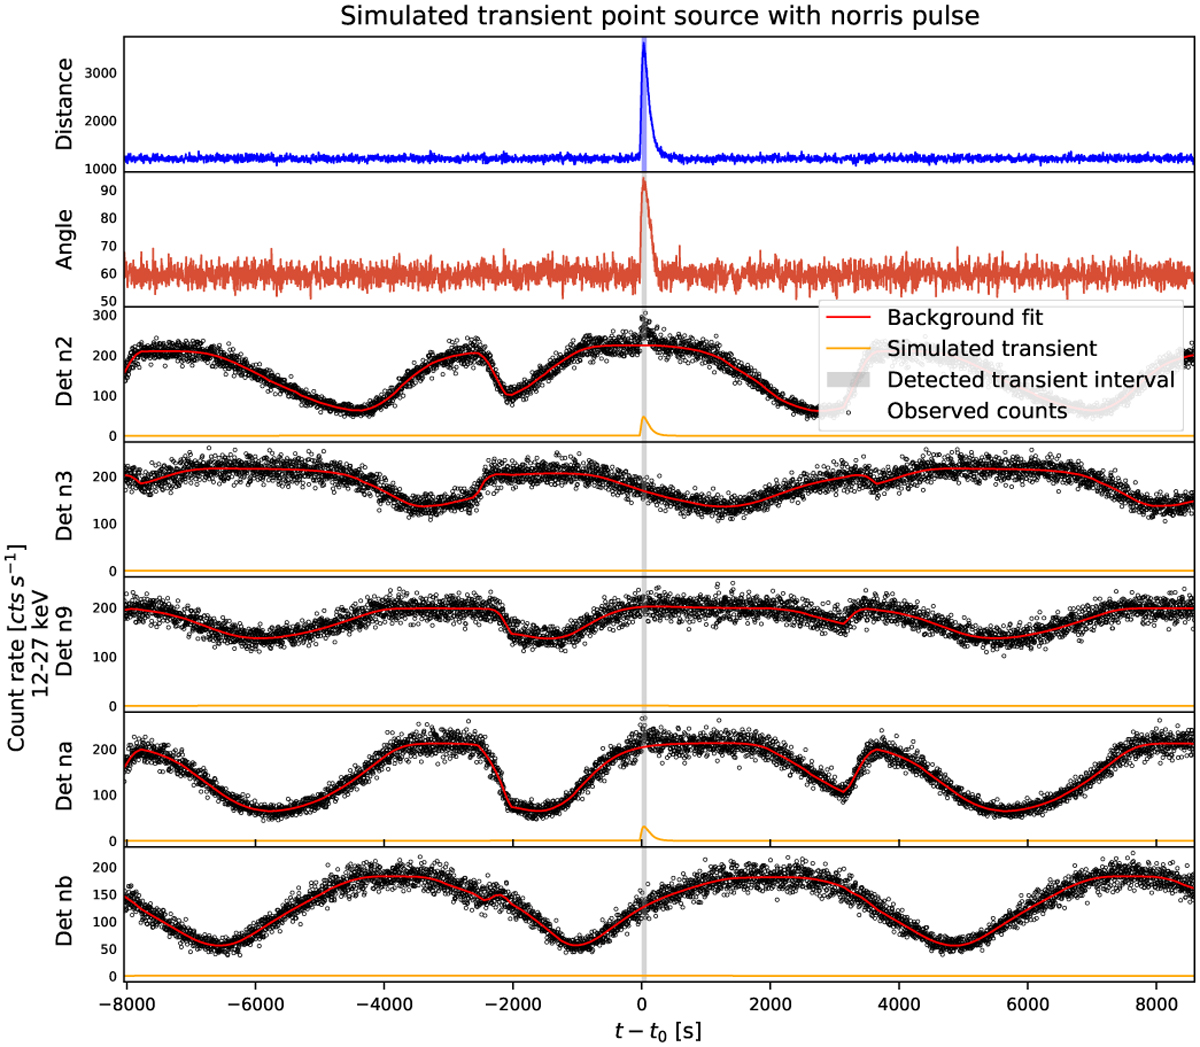
Light curves of a simulated transient point source with a Norris pulse time evolution on top of a simulated background. The count rate of the simulated transient is shown in orange, the background fit in red and the time interval detected by the algorithm is highlighted in gray. The projection to the distance and angle measure is shown as a reference in the upper two subplots.
Current usage metrics show cumulative count of Article Views (full-text article views including HTML views, PDF and ePub downloads, according to the available data) and Abstracts Views on Vision4Press platform.
Data correspond to usage on the plateform after 2015. The current usage metrics is available 48-96 hours after online publication and is updated daily on week days.
Initial download of the metrics may take a while.