Fig. 3
Download original image
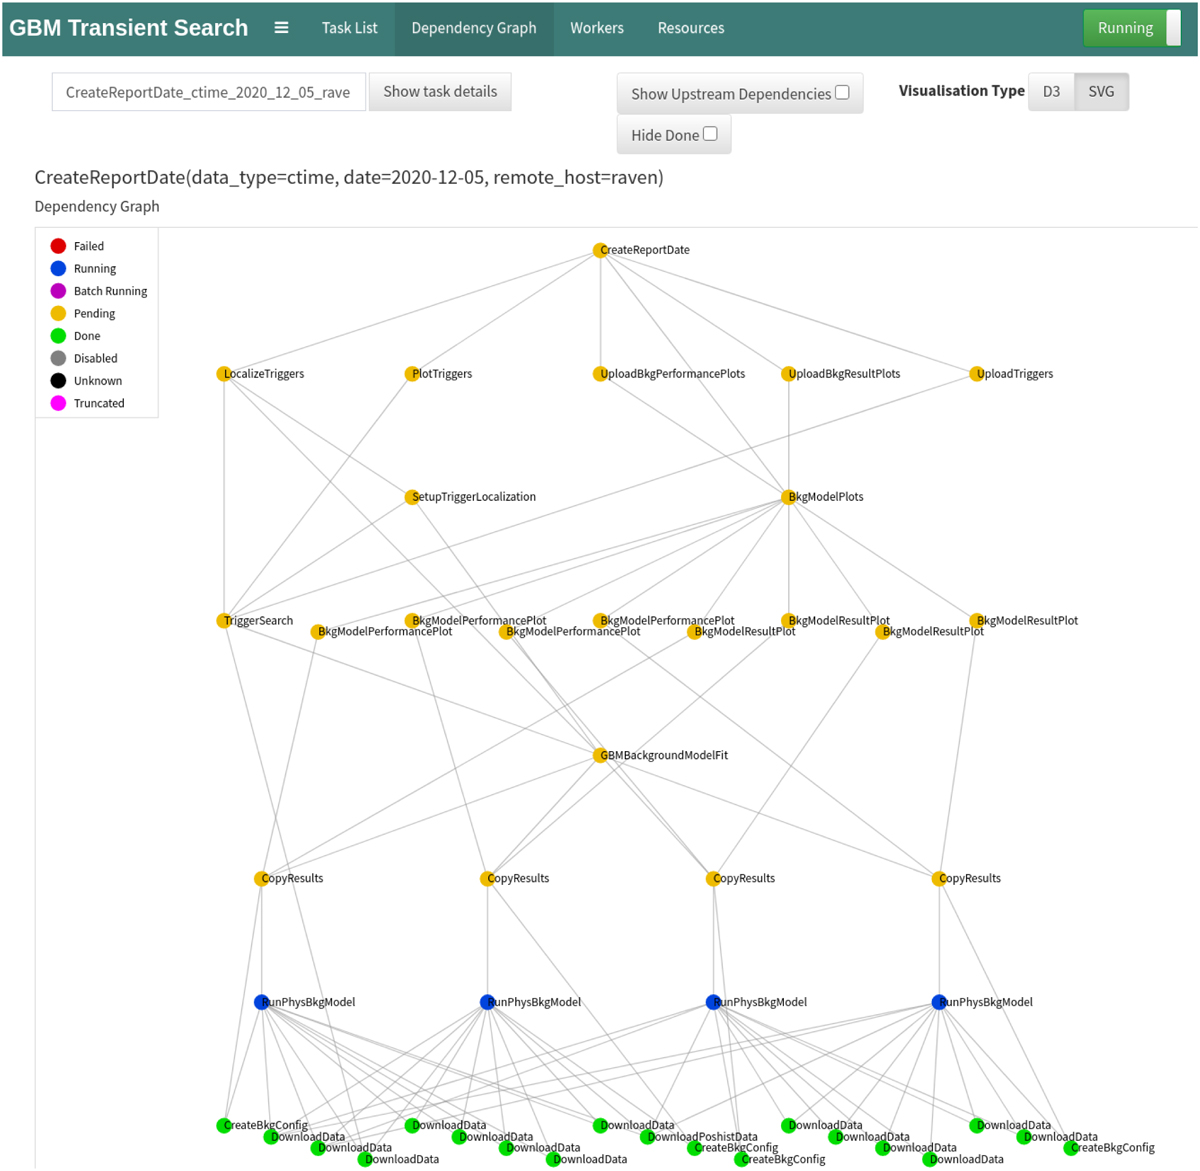
Dependency graph of the transient search pipeline, processing one day of data. Tasks that are already processed are marked with green circles, blue circles indicate tasks that are currently running, and yellow circles indicate tasks that are pending due to missing; dependencies. The processing starts at the bottom and the pipeline is currently running the fit of the background model (“RunPhysBkgModel”). The following step, called “TriggerSearch,” will run She change point detection (see Sect. 2.2) and source detection (see Sect. 2.3) oh the transient detection algorithm. The subsequent “SetupTriggerLocalization” step will dynamically add individual tasks for localization and spectral analysis (see Sect. 2.4) for every found trigger. All found transient signals are then uploaded to the GRB Science Dashboard (https://grb.mpe.mpg.de).
Current usage metrics show cumulative count of Article Views (full-text article views including HTML views, PDF and ePub downloads, according to the available data) and Abstracts Views on Vision4Press platform.
Data correspond to usage on the plateform after 2015. The current usage metrics is available 48-96 hours after online publication and is updated daily on week days.
Initial download of the metrics may take a while.