Fig. 2
Download original image
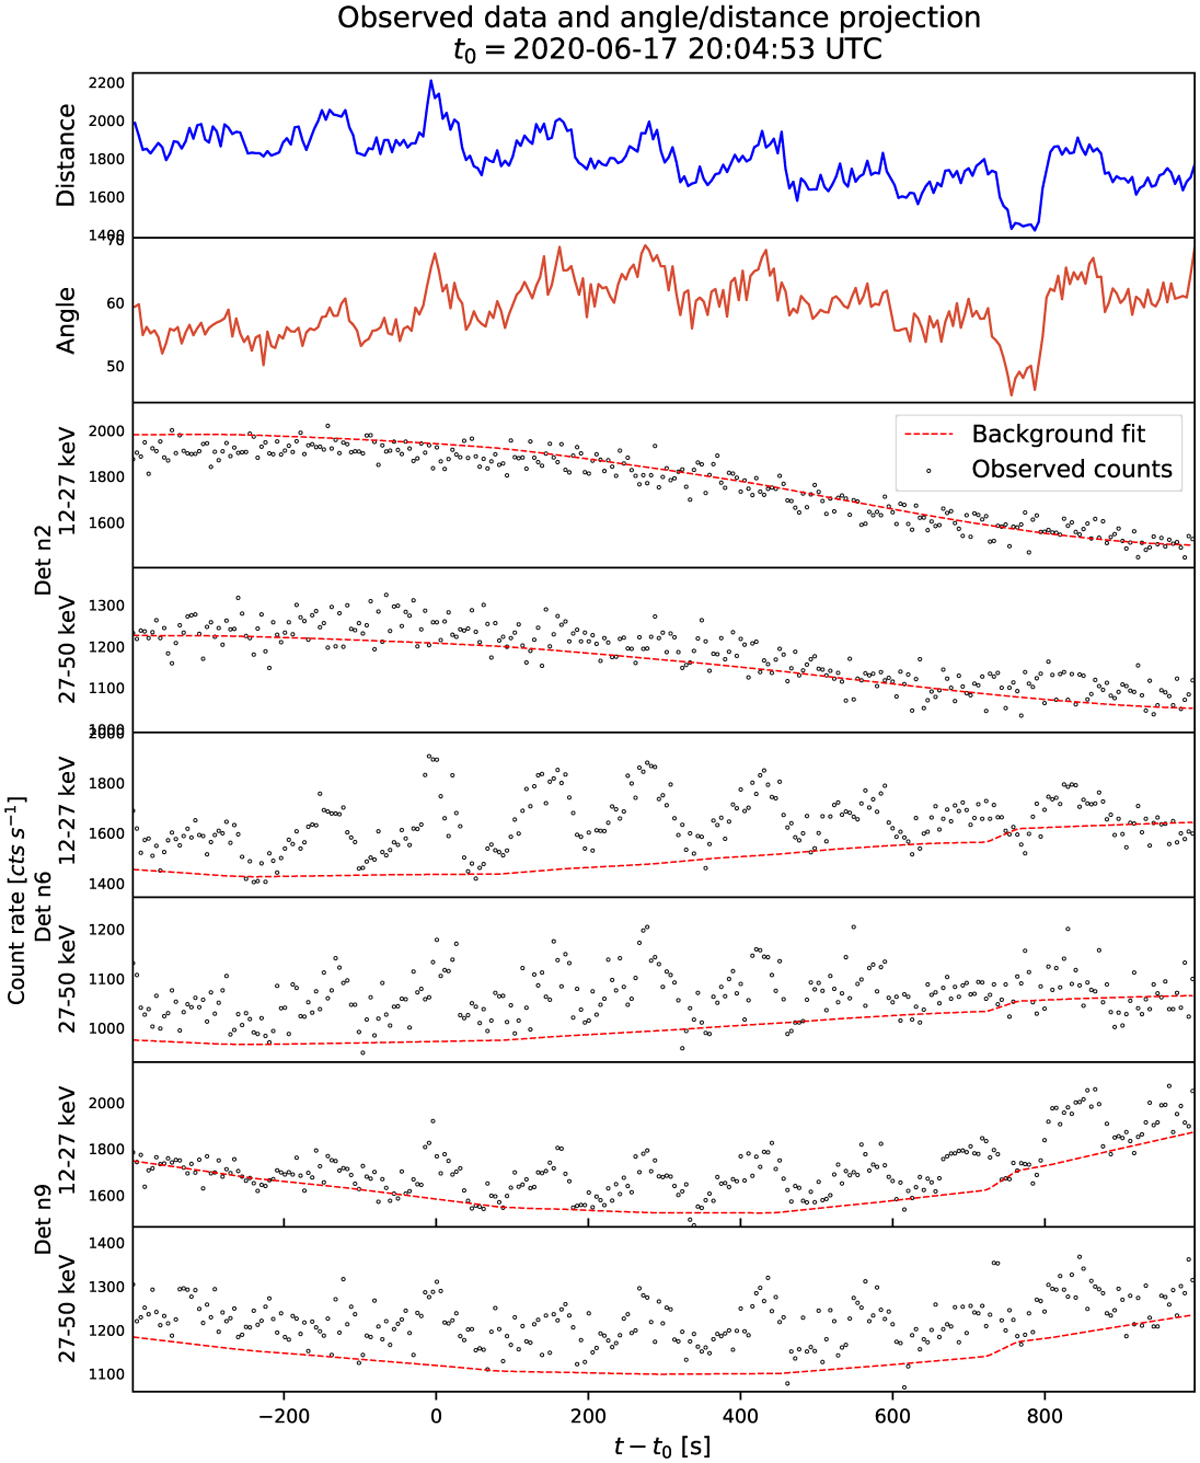
Observed data (black dots) and the background fit (dashed red line) of the three detectors n2, n6 and n9 for the energy range of 12–27 keV and 27–50 keV with a time binning of 5s in comparison to the projected angle and distance measure. The displayed time-window contains the triggered signal (at time t0), discussed in Sect. 5.
Current usage metrics show cumulative count of Article Views (full-text article views including HTML views, PDF and ePub downloads, according to the available data) and Abstracts Views on Vision4Press platform.
Data correspond to usage on the plateform after 2015. The current usage metrics is available 48-96 hours after online publication and is updated daily on week days.
Initial download of the metrics may take a while.