Open Access
Fig. 14
Download original image
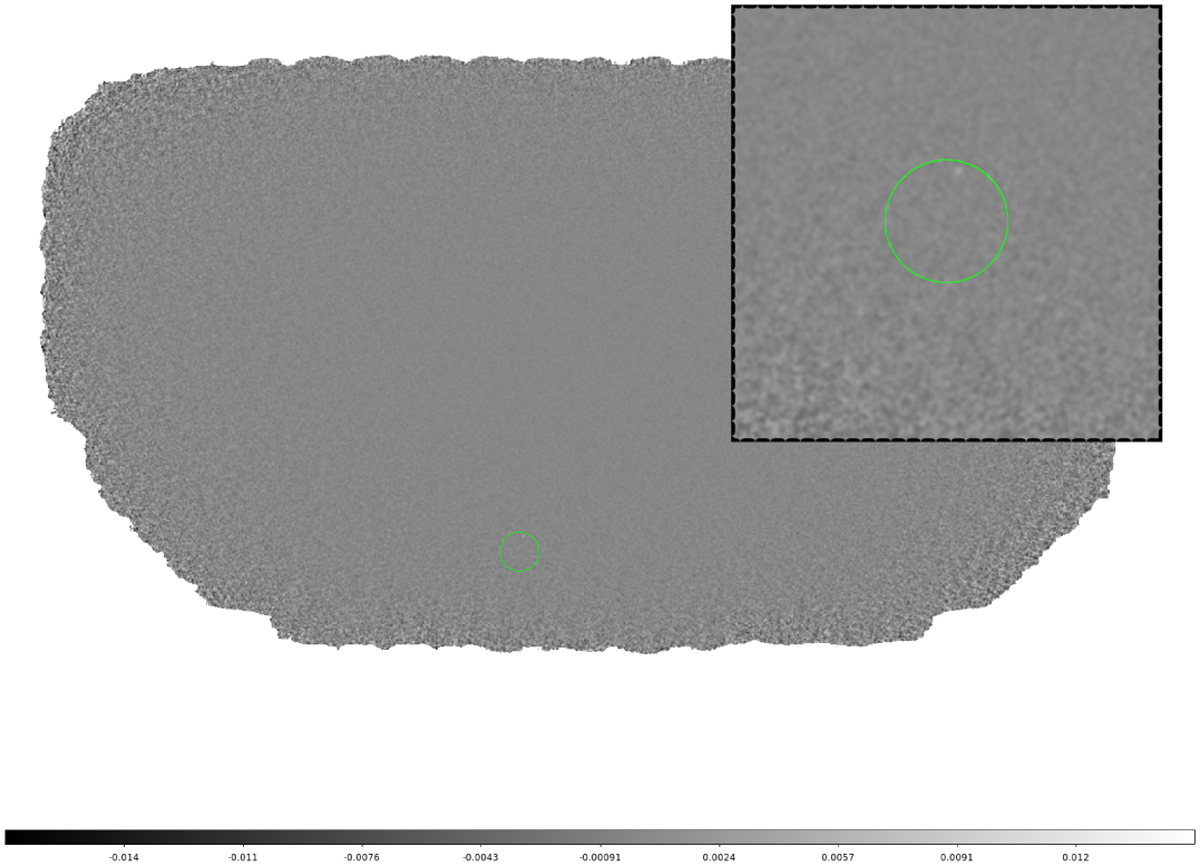
Sky map from the Swifi/BAT observation 00013484027 produced with the batsurvey tool. It shows the detected point source (white spot) that lies within the error region of the BALROG position (light green circle) of the transient Vela X-1. The color bar shows the intensity in units of counts/s.
Current usage metrics show cumulative count of Article Views (full-text article views including HTML views, PDF and ePub downloads, according to the available data) and Abstracts Views on Vision4Press platform.
Data correspond to usage on the plateform after 2015. The current usage metrics is available 48-96 hours after online publication and is updated daily on week days.
Initial download of the metrics may take a while.