Open Access
Fig. 8.
Download original image
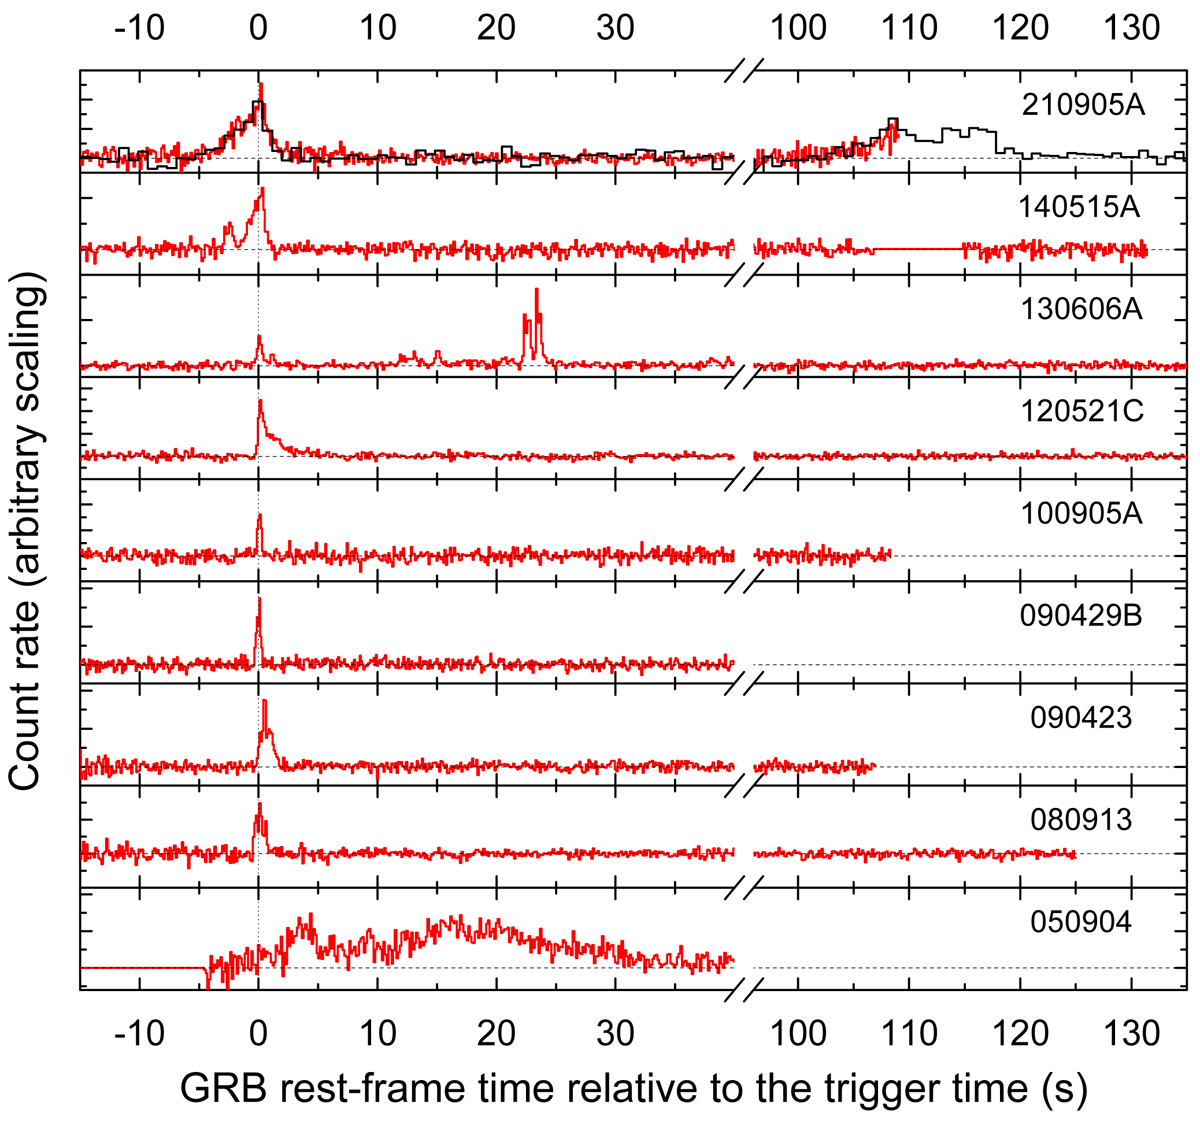
GRB 210905A prompt-emission light curve (top panel) in the context of eight high-redshift GRBs (z ≥ 6). Arbitrarily scaled BAT count rates (15 − 350 keV) are plotted in red against time in the GRB rest frame. The KW light curve of GRB 210905A is plotted in black. The vertical dotted line shows the trigger time.
Current usage metrics show cumulative count of Article Views (full-text article views including HTML views, PDF and ePub downloads, according to the available data) and Abstracts Views on Vision4Press platform.
Data correspond to usage on the plateform after 2015. The current usage metrics is available 48-96 hours after online publication and is updated daily on week days.
Initial download of the metrics may take a while.