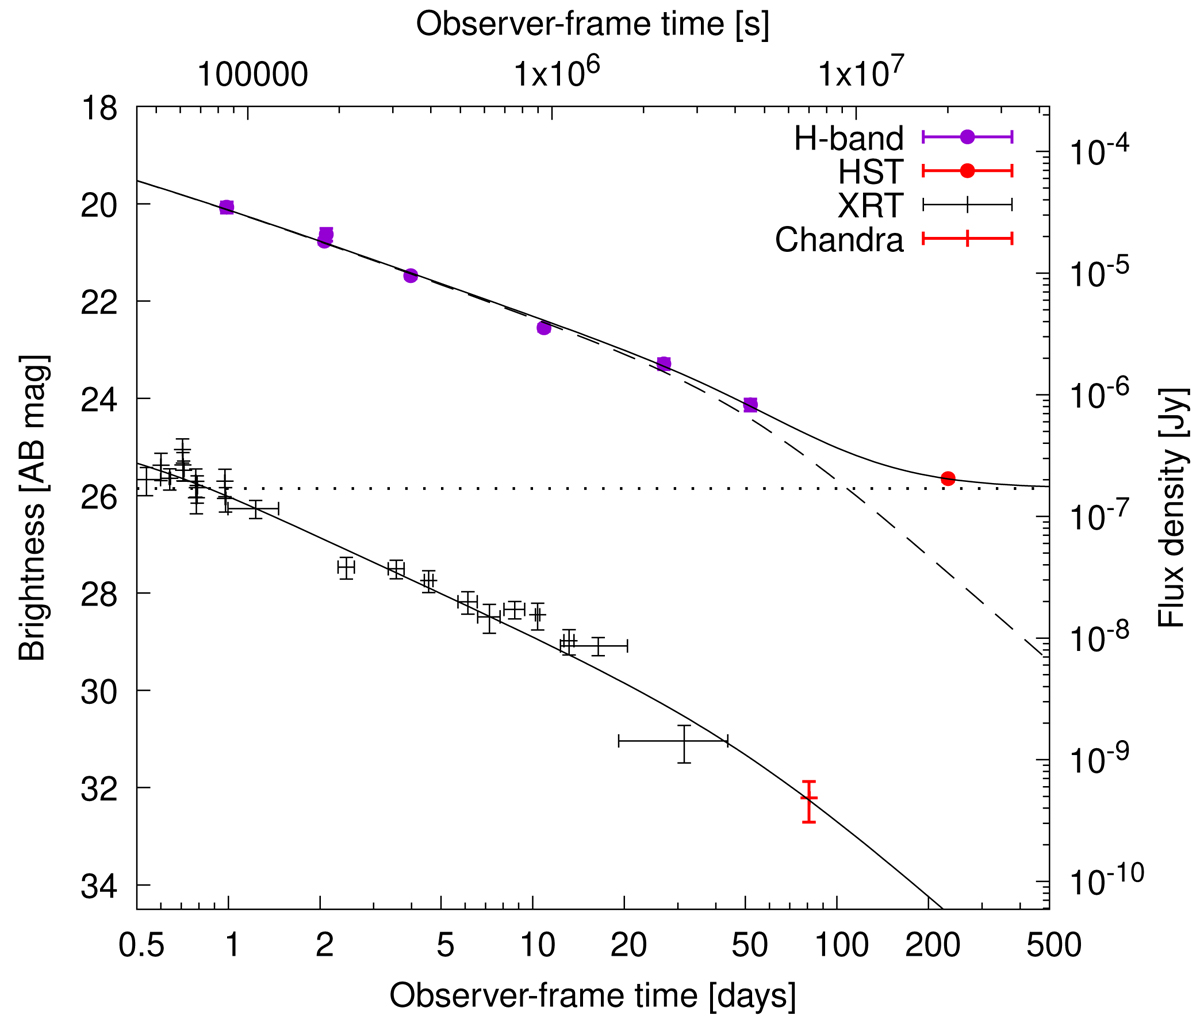
Fig. 6.
Download original image
Observer-frame H-band (purple) and X-ray (black) light curves. Solid lines show the joint fit with a smoothly-broken power-law, assuming common achromatic breaks. The dashed line shows the H-band light curve without constant component. The horizontal dotted line shows the modelled H-band constant component. Following the slow-cooling scenario (Sect. 3.3), we fixed the pre-break decay indices to αopt = 0.9 and αX = 1.15. The last break is interpreted as a jet break, and thus the post-break decay index has been fixed to αopt, X = p = 2.2. The late flattening in the H-band light curve can be explained by a constant contribution from a host or intervening system. See Sect. 3.5 for details.
Current usage metrics show cumulative count of Article Views (full-text article views including HTML views, PDF and ePub downloads, according to the available data) and Abstracts Views on Vision4Press platform.
Data correspond to usage on the plateform after 2015. The current usage metrics is available 48-96 hours after online publication and is updated daily on week days.
Initial download of the metrics may take a while.