Fig. 5.
Download original image
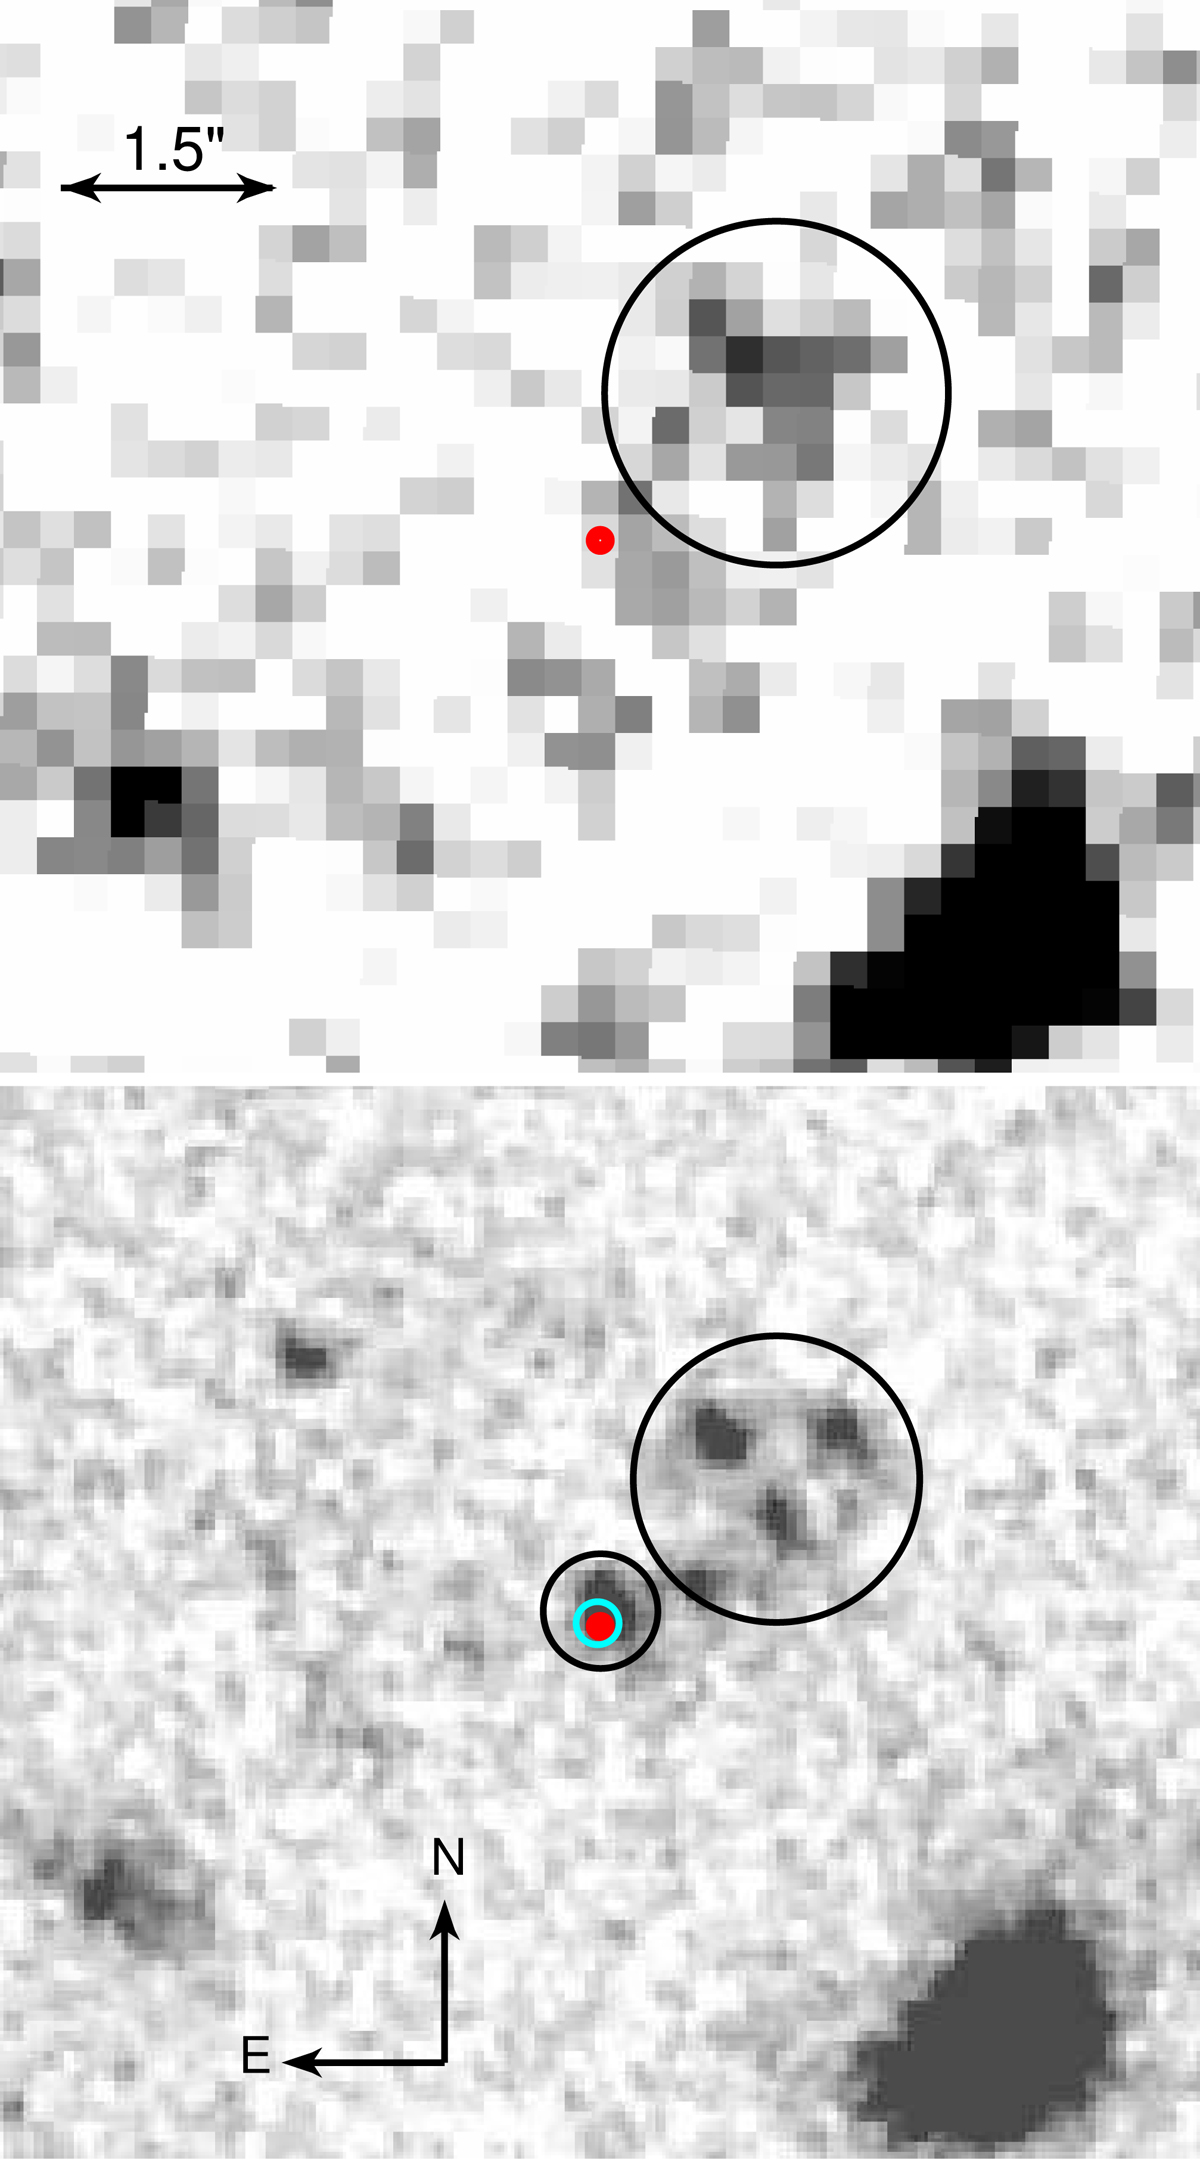
Zoom-in to the 10″ × 10″ region centred on the afterglow. Top: deep FORS2 IBessel-band image obtained 87 d after the GRB trigger. The red point indicates the ALMA localisation of the afterglow. A faint source, highlighted with a black circle, lies ![]() NW of the afterglow position. The radius of the circle is that of the aperture used for photometry. Bottom: for comparison, the HST/F140W image shows several sources at the position of the IBessel-band source. The cyan circle shows the location of the NIR afterglow and its error (Sect. 2.2), measured in the first HAWK-I H-band observation.
NW of the afterglow position. The radius of the circle is that of the aperture used for photometry. Bottom: for comparison, the HST/F140W image shows several sources at the position of the IBessel-band source. The cyan circle shows the location of the NIR afterglow and its error (Sect. 2.2), measured in the first HAWK-I H-band observation.
Current usage metrics show cumulative count of Article Views (full-text article views including HTML views, PDF and ePub downloads, according to the available data) and Abstracts Views on Vision4Press platform.
Data correspond to usage on the plateform after 2015. The current usage metrics is available 48-96 hours after online publication and is updated daily on week days.
Initial download of the metrics may take a while.