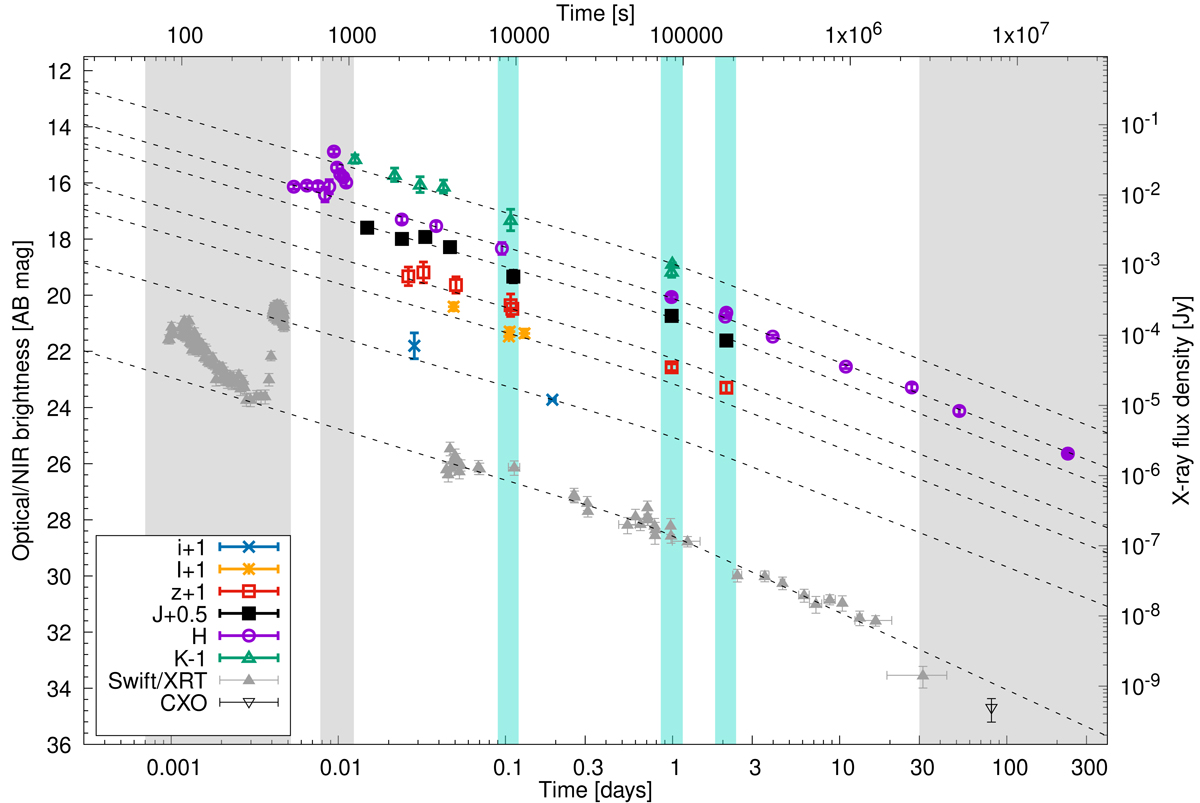
Fig. 3.
Download original image
Optical and X-ray light curves. The dashed lines show the fit to each single band assuming a smoothly broken power-law model. The grey intervals are not considered in the first modelling of the light curves. Those in light blue have been used for the SED fitting (see Sect. 3.3). The X-ray light curve is computed at 1.73 keV, the log-mean of the XRT band. The last H-band data corresponds to the HST/F140W detection. No colour correction was necessary as explained in Sect. 3.5.
Current usage metrics show cumulative count of Article Views (full-text article views including HTML views, PDF and ePub downloads, according to the available data) and Abstracts Views on Vision4Press platform.
Data correspond to usage on the plateform after 2015. The current usage metrics is available 48-96 hours after online publication and is updated daily on week days.
Initial download of the metrics may take a while.