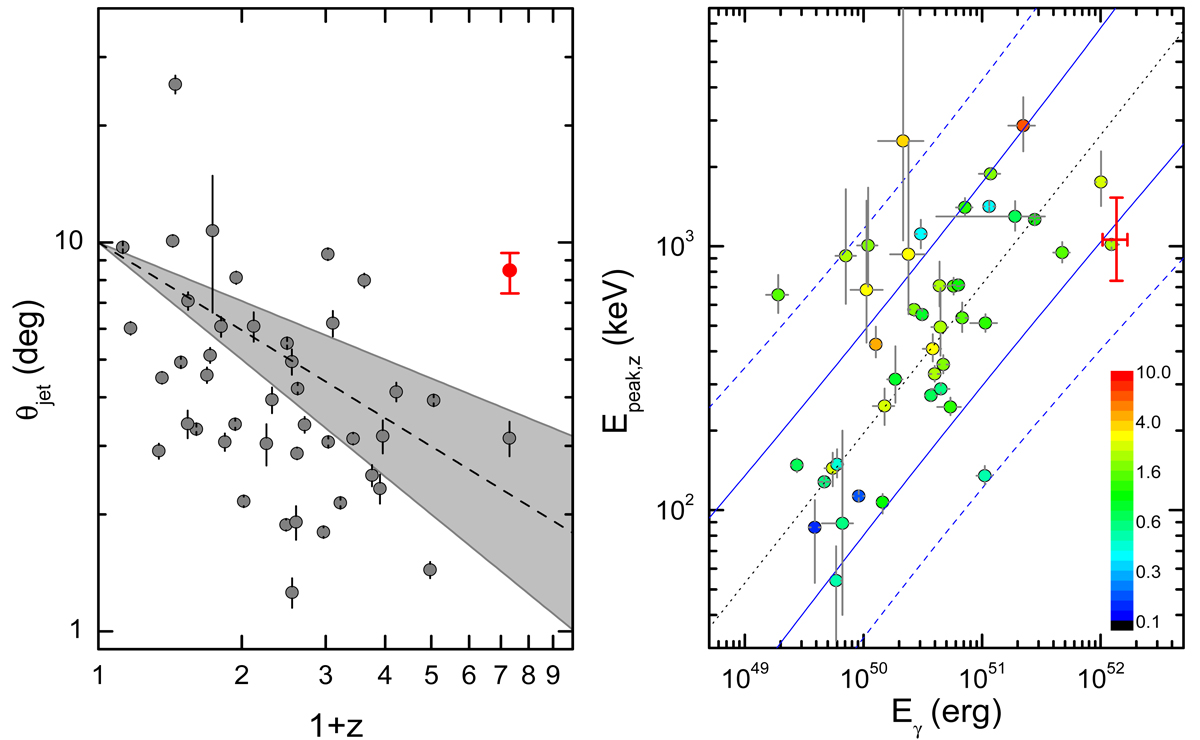
Fig. 12.
Download original image
Collimated parameters of GRB 210905A (red symbols) compared to a KW sample of 43 long GRBs from Tsvetkova et al. (2017, 2021). We assumed η = 0.2 and n = 1 cm−3 for all bursts. Left: half-opening angle θjet versus redshift. The dashed line within the grey area shows the relation found in Lloyd-Ronning et al. (2020a) with its error. Right: Eγ − Epeak, z diagram. As in Fig. 7, the colour of each data point represents the burst’s redshift. The ‘Ghirlanda’ relation is plotted together with its 68% and 90% PIs.
Current usage metrics show cumulative count of Article Views (full-text article views including HTML views, PDF and ePub downloads, according to the available data) and Abstracts Views on Vision4Press platform.
Data correspond to usage on the plateform after 2015. The current usage metrics is available 48-96 hours after online publication and is updated daily on week days.
Initial download of the metrics may take a while.