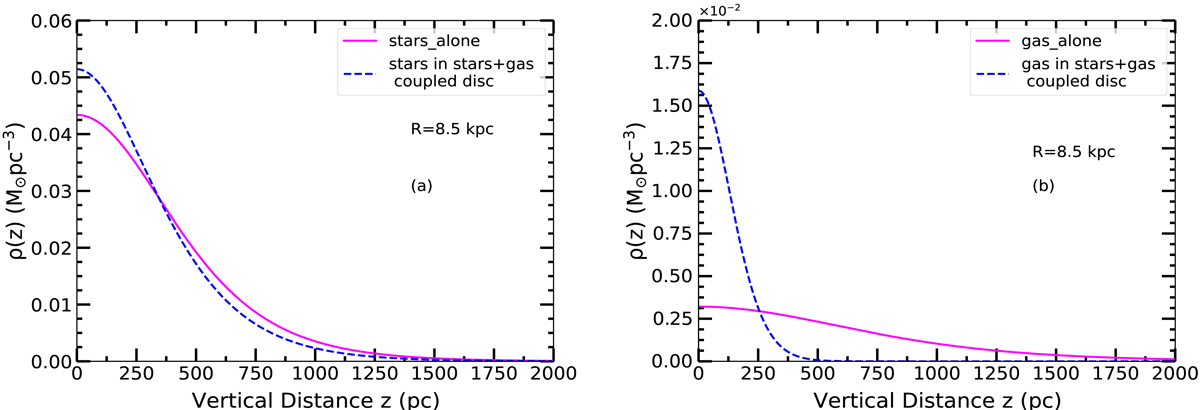
Fig. 1.
Download original image
Stellar and gas (HI) vertical density distribution, ρ(z) vs. z at R = 8.5 kpc (panels a and b, respectively). In each plot, the solid curve represents the vertical distribution in the one-component case. The dashed curve represents the distribution obtained in the gravitationally coupled stars-plus-gas system. The coupled gravitational force of the star- plus-gas system constrains each distribution towards the mid-plane, i.e., increases the mid-plane density value of the distribution, which causes the scale height to become smaller and the curve to become steeper.
Current usage metrics show cumulative count of Article Views (full-text article views including HTML views, PDF and ePub downloads, according to the available data) and Abstracts Views on Vision4Press platform.
Data correspond to usage on the plateform after 2015. The current usage metrics is available 48-96 hours after online publication and is updated daily on week days.
Initial download of the metrics may take a while.