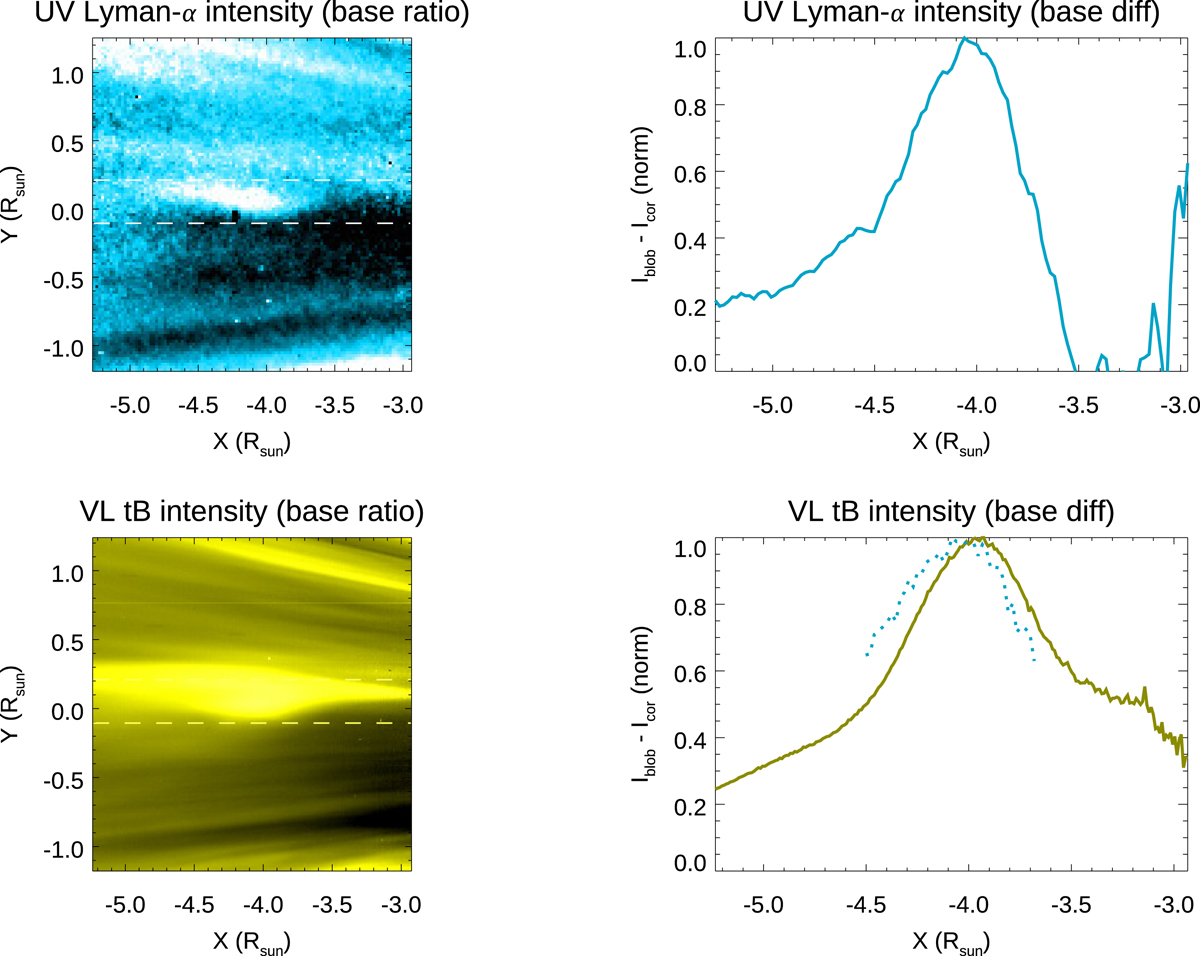
Fig. 9.
Download original image
Propagation of the post-CME plasma blob as observed by the two Metis channels. Left: zoom of the expanding small-scale post-CME plasma blob observed by Metis on February 13 between 08:15 and 08:46 UT in the UV (top) and the VL (tB, bottom) channels (see also the bottom right panel of Fig. 7). These images are obtained from the ratio of the actual frames and those acquired between 12:15 and 12:46 UT on February 12; the horizontal dashed lines mark the area in which the VL and UV intensities have been averaged to create the east-west profiles shown in the right panels. Right: normalized UV (top) and VL (tB, bottom) east-west intensity profiles as obtained by averaging north-south over the areas shown with horizontal dashed lines in the left panels. These profiles are obtained after a subtraction of the actual frames and those acquired between 12:15 and 12:46 UT on February 12. The dotted line in the bottom right panel shows a comparison to the square root of the UV profile shown in the top right panel (see text for explanations).
Current usage metrics show cumulative count of Article Views (full-text article views including HTML views, PDF and ePub downloads, according to the available data) and Abstracts Views on Vision4Press platform.
Data correspond to usage on the plateform after 2015. The current usage metrics is available 48-96 hours after online publication and is updated daily on week days.
Initial download of the metrics may take a while.