Free Access
Fig. 7.
Download original image
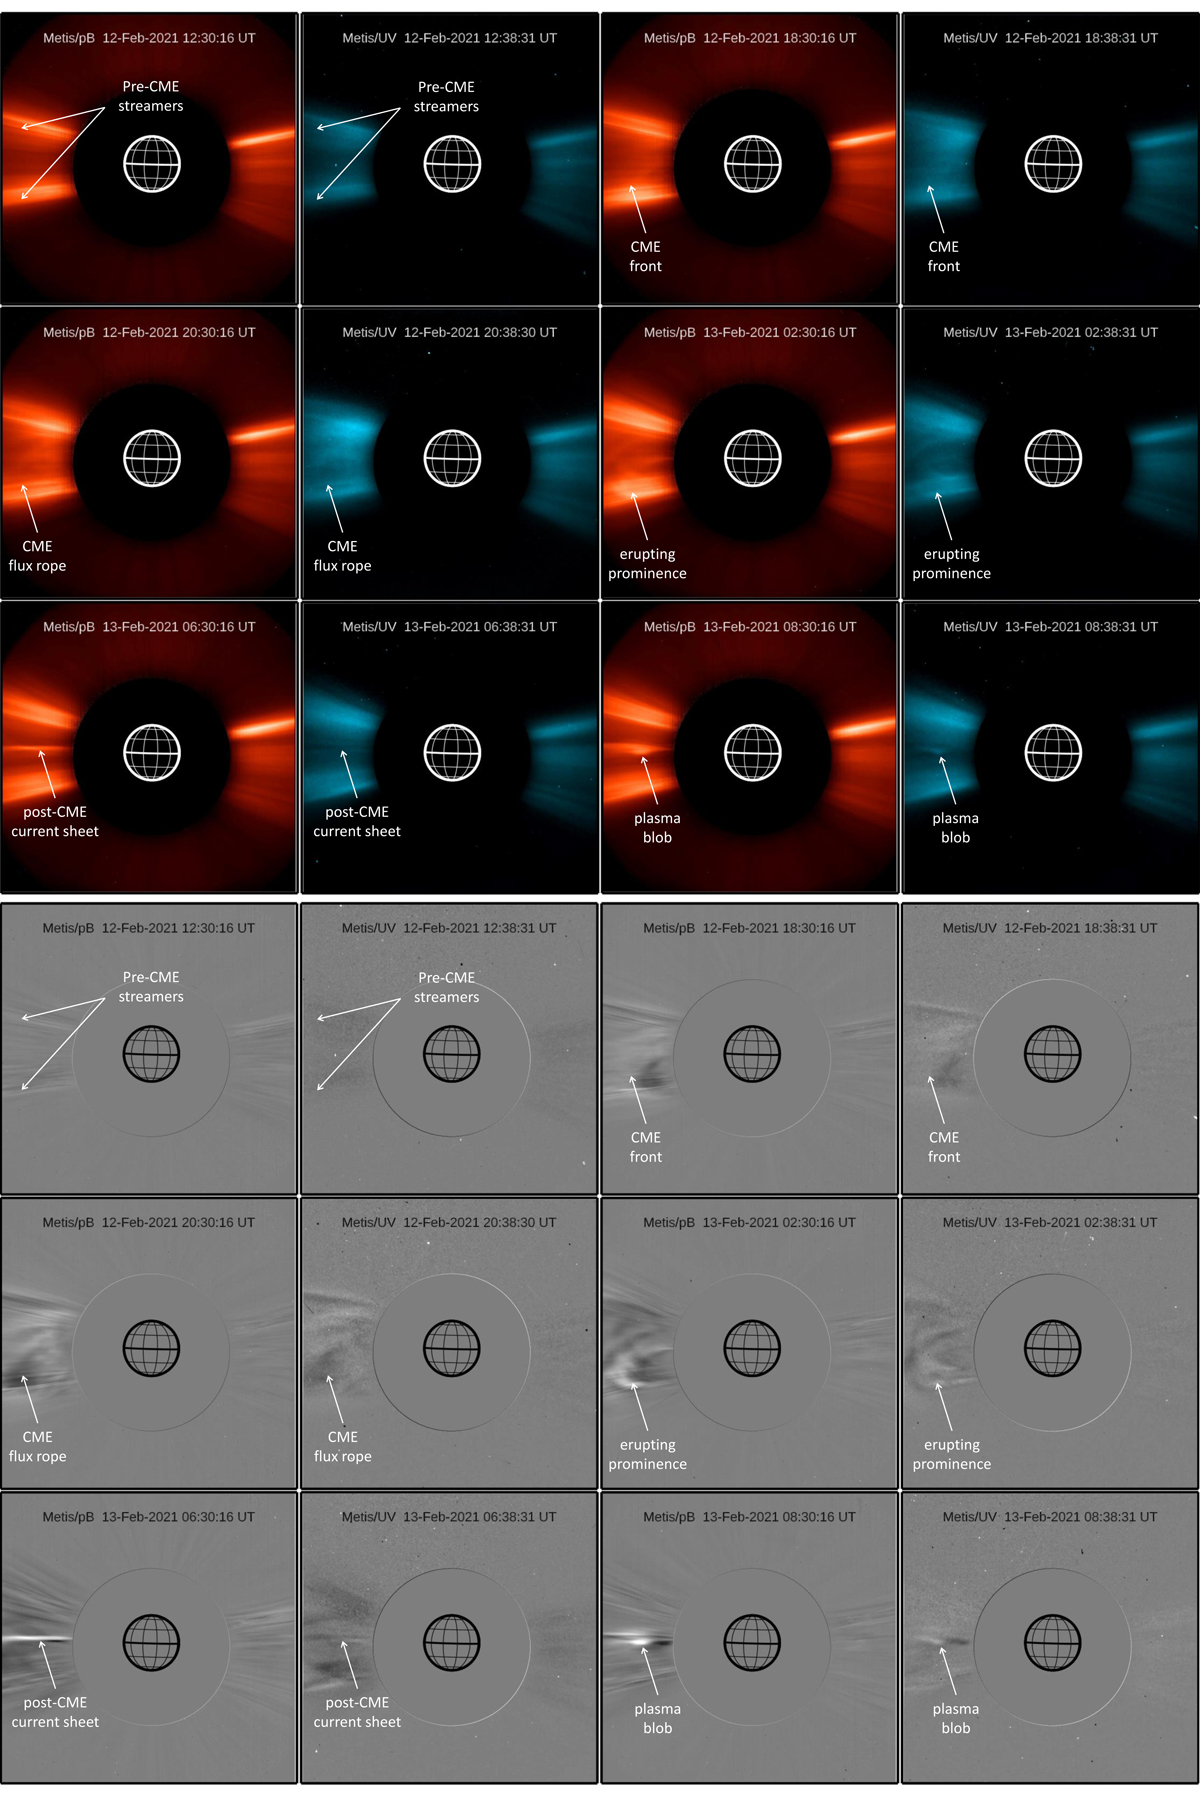
Sequence of events between 2021 February 12–13, as observed by the Metis coronagraph in the VL (red) and UV (cyan) channels (see text). The top panel shows regular intensity images, and the bottom panel shows the corresponding running-difference images. A movie is available online
Current usage metrics show cumulative count of Article Views (full-text article views including HTML views, PDF and ePub downloads, according to the available data) and Abstracts Views on Vision4Press platform.
Data correspond to usage on the plateform after 2015. The current usage metrics is available 48-96 hours after online publication and is updated daily on week days.
Initial download of the metrics may take a while.